Confirming payment details

Payment processing
Login or Sign up
Forgot password
Enter your email address and we will send you a password reset link or need more help?
UK House Price Index – October 2020
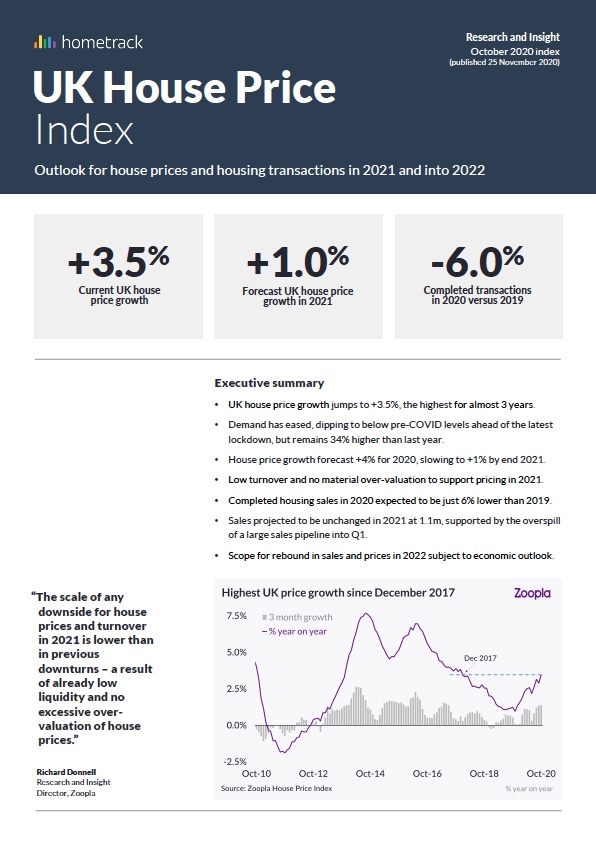
By Richard Donnell on 25 November 2020- UK house price growth jumps to +3.5%, the highest for almost 3 years
- Demand has eased, dipping to below pre-COVID levels ahead of the latest lockdown, but remains 34% higher than last year
- House price growth forecast +4% for 2020, slowing to +1% by end 2021
The first quarter of 2021 is set to record a property uplift, with 100,000 additional sales expected to complete before the end of March. As buyers rush to beat the stamp duty deadline, the increased transaction pipeline from the final months of 2020 will spill over into the new year.
Annual UK house price inflation +3.5%
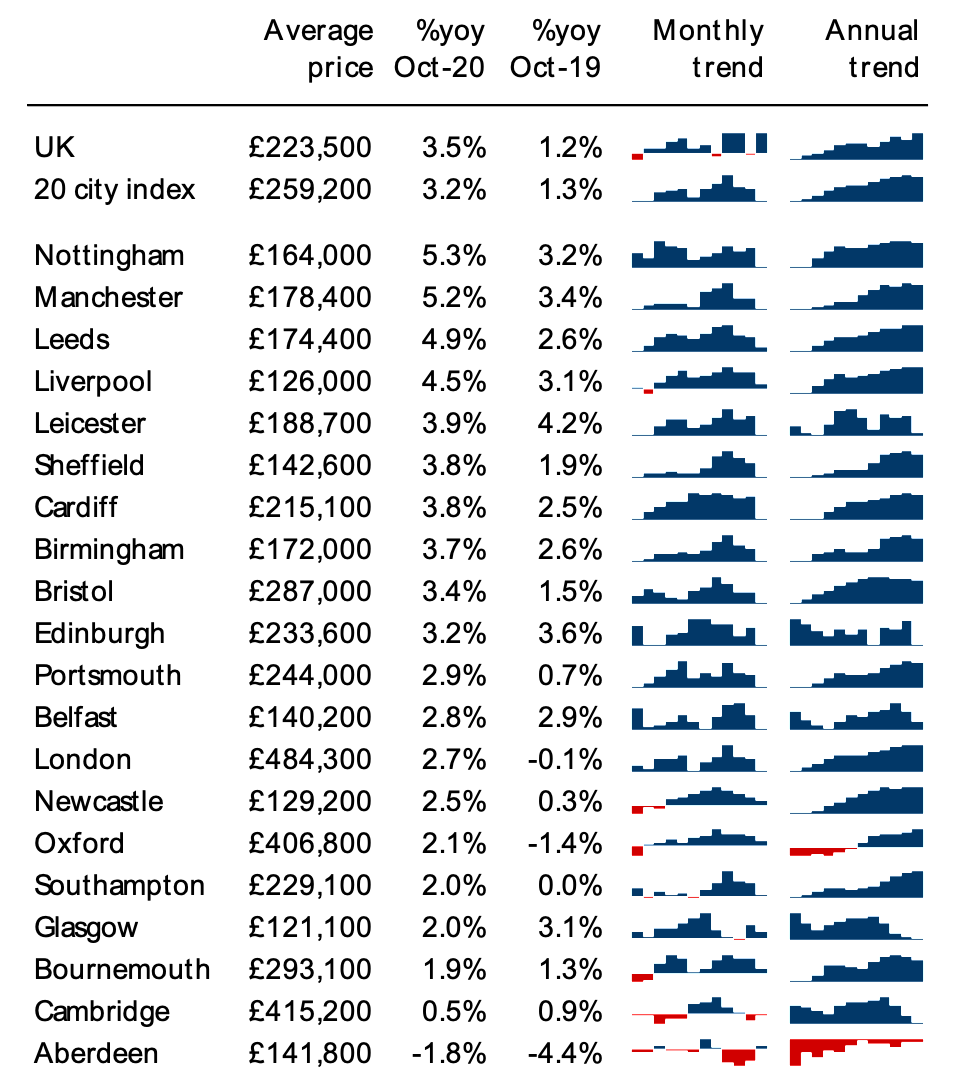
High demand and rising activity continues to push the rate of UK house price growth higher, to +3.5% in October, up from +1.2% a year ago.
At a region and country level, house price growth is over 4% in the North West, Wales, Yorkshire and the Humber and the East Midlands.
At a city level, Nottingham and Manchester are recording annual price inflation of over 5% with all cities recording higher growth rates than a year ago.
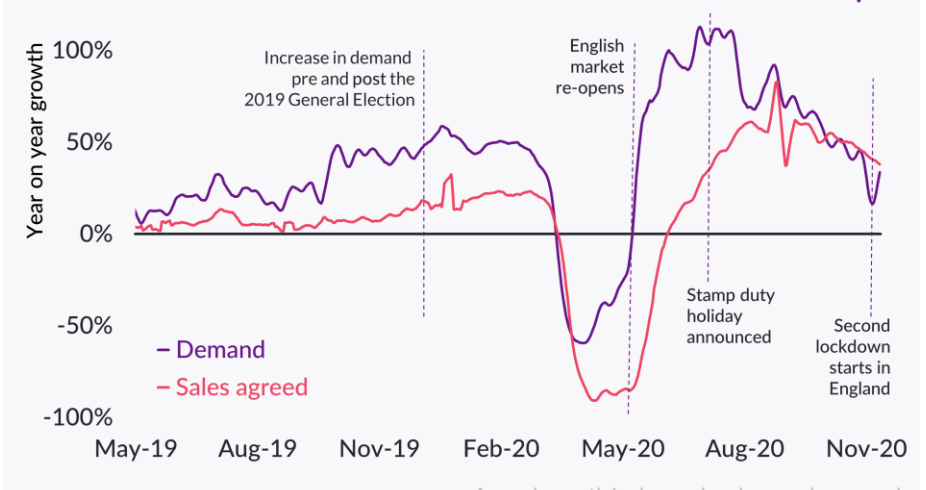
A rollercoaster year for demand which has dipped lower
Demand for housing has been slowing since the summer and has fallen below pre-lockdown levels yet remains 34% higher than this time last year.
There was a sharp dip as the latest lockdown in England was announced, which rebounded once it began. High demand, and more available supply, has boosted the number of sales agreed, currently running 38% higher than a year ago, adding to the sizeable pipeline of business moving towards completion in 2020 Q4 and 2021 Q1.
We expect sales agreed to run above average in the weeks ahead.
Complex array of factors that will shape the market in 2021
We expect a seasonal spike in demand in January 2021 as households enter the market in the hope of completing a sale by the end of March and to take advantage of the stamp duty holiday.
Just over 50% of sales agreed in January will make it. Beyond that we expect demand to slow as the impetus to move for stamp duty savings dissipates for a portion of would-be buyers.
There are several factors that will shape the housing market outlook, with the pandemic adding to the uncertainty. Our top factors are set out below:
Vaccine:
Progress on COVID -19 vaccines will determine how quickly restrictions in movement during lockdowns, and therefore activity in key sectors of the economy, can be relaxed.
We assume a vaccine to help ease restrictions and support a return towards normality from 2021 H2.
Economic outlook:
Economic growth is set to rebound in 2021, supported by an array of Government support, yet the unemployment rate is expected to move higher towards 6.5% while income growth is muted.
We expect higher unemployment to impact market sentiment and levels of activity over 2021.
Trade deal with Europe:
Negotiations on a trade deal look set to go to the wire. In the absence of a comprehensive free trade deal, we assume some form of agreement will be struck to keep the flow of goods running, but with some possible impact on economic growth and trade early in 2021.
High LTV mortgages:
Lenders have reduced the availability of home loans for those with small deposits which is impacting first time buyer (FTB) demand. Half of FTBs use loans of 85% loan to value (LTV) or more.
A prolonged lack of higher LTV finance would impact housing chains and create further downside risks to the market outlook in 2021.
We expect lenders to return to higher LTV lending in 2021 Q1, but not initially at the scale and competitive pricing seen in recent years.
Mortgage payment deferral and forbearance:
The number of forced sellers in a market impacts the outlook for pricing. We expect continued support for mortgage borrowers to limit the number of forced sales.
This is a result of the extended mortgage payment deferral scheme to March 2021 and an expectation that lenders will continue to pursue forbearance policies in response to increasing arrears rates over 2021 H1.
Policy change:
Tax increases and the impact on household finances is an important factor as the Government looks to reduce record debt – a factor that will run well beyond 2021.
Higher rates of capital gains tax are likely to be announced affecting private investors and second homeowners.
The timing of any change is key - a delayed implementation would provide a limited boost to housing supply as owners crystalise gains before new rules come into force. Further policy changes to support the housing market and economy can not be ruled out in 2021.
Lifestyle changes and evolved working practices:
The latent demand unlocked by the first lockdown has further to run in our view when combined with ongoing changes to working patterns for a proportion of the population. This to likely to provide support to sales volumes in 2021.
Downside for house prices and turnover are limited in 2021
While the near-term headwinds are clear, it is important to consider the broader context. In our view, the scale of any downside for prices and turnover in 2021 is lower than in previous downturns - this is down to two factors:
- Lower market liquidity and a decline in sales volumes over the last 5 years
- No recent build-up to an excess over-valuation of house prices
Sales volumes and market liquidity low by historic standards
Housing sales volumes (recorded by HMRC) have been stuck at 1.1m to 1.2m for the last 6 years - in line with the 50-year average, indicating the average household moves once every 20 years.
In 2019 sales were 5% lower than 2016. At a regional level, sales in London and the South East were 30% and 20% lower than in 2015 as tax changes and mortgage regulation impacted demand and activity.
The reality is that sales volumes have already contracted, limiting to some degree, the scale of further falls in volumes. In the 2008/09 recession sales fell below 900,000 a year, meaning we are not so far from this baseline.
Lower market liquidity may well create scarcity which, in turn, supports pricing but it also makes for greater volatility in house prices with more variation in price trends between local markets and within property types.
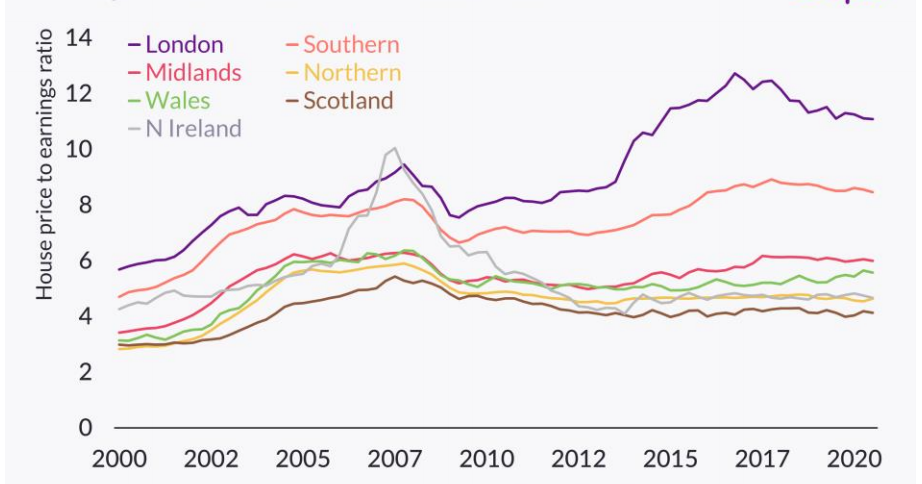
No excess over-valuation of UK house prices
History shows that house price falls tend to be exacerbated when following periods of high and unsustainable price inflation in the 2-3 years before the market turns.
Mortgage regulation and tax changes have limited the use of greater borrowing to bid up the cost of housing. Price growth has slowed over recent years with prices falling in London and southern England over 2018-19.
The house price to earnings ratio by region and country reveals most areas are in line with the 15-year average with affordability remaining manageable in many regions outside southern England.
Affordability levels have improved in London but remain a barrier to any rapid growth in sales volumes or prices.
Sales completions 6% lower in 2020 and unchanged over 2021
The sales pipeline is 50% bigger than this time last year and we expect completed UK housing transactions to be 1.1m in 2020, just 6% lower than in 2019 – a major improvement on the outlook earlier this year.
Sales have rebounded faster and off a lower base in London and southern England where we expect sales completions in 2020 to be up to 7% higher than in 2019.
Sales completions in Scotland, Wales and Northern Ireland are expected to be lower than in 2019 by up to 12% with their markets closed for longer in 2020 than across England.
Looking ahead to 2021 there is a sizeable pipeline of sales that will complete in Q1 which will provide a boost to the annual total - we expect completed sales in 2021 to be in line with 2020 levels at 1.1m.
If it was not for this ‘boosting effect’ we believe sales completions would have totalled 1m, down 9% on 2020.
Stamp duty disruption to Q2 2021
Notwithstanding our view that the current drivers of demand are not solely a result of the stamp duty holiday, history shows that these tax deadlines do distort the profile of completions in the immediate period after.
Our forecast for turnover in 2021 assumes that sales completions to run 20- 30% below normal levels over Q2 2020 and to then run 10% below 2019 levels until the year end.
This reflects economic factors impacting market sentiment and that fact that a proportion of sales are likely to have been brought forward into 2020 and 2021 Q1.
Much depends upon the economic outlook and progress for national vaccine to suppress the pandemic. Assuming the economic outlook improves, and employment levels start to recover later in 2021 we see scope for a stronger rebound in sales volumes in 2022 taking them back towards 2019 levels.
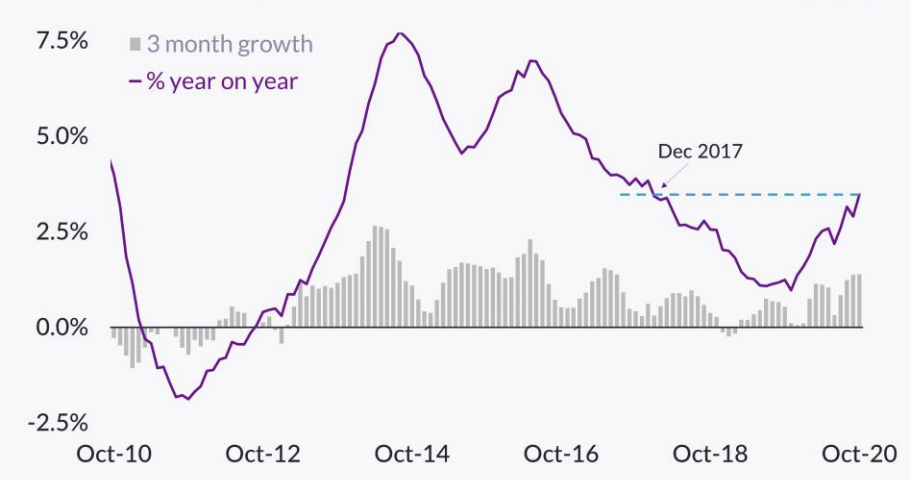
UK house price growth close to 3-year high
All house price indices have reported a jump in price inflation in recent months driven by strong demand, more sales and a shift in the mix of homes transacting with more sales in wealthier demographics and at higher prices.
Not all indices manage the changing mix of transactions in the same way hence the variation in reported growth rates. Our house price index is based on the largest sample of pricing for any index - using data from completed sales, mortgage valuations and newly agreed sales. The annual growth rate is as high as in December 2017.
UK house price growth slows to +1% in 2021
In order to inform the outlook for house prices Zoopla Research have developed a multi-factor forecasting model using a combination of long run macro factors and unique, high frequency data on the housing market.
The core output is a one-year house price projection at region, country and national level. We expect house price inflation to end 2020 at 4% and then slow to 1% by the end of 2021 as weaker demand and economic uncertainty reduces the upward pressure on prices.
At a regional level we expect growth to fall within a narrow range between +1.75% in Scotland to +0.5% in the East of England.
These central forecasts reflect the price change for all UK housing based on the transactions that take place in the year. Shifting patterns of demand and an uneven economic impact from the pandemic means local market factors will continue to drive activity levels and pricing in local markets.
There is a distribution of growth around the national and regional averages. The improvement in growth is widespread with 80% of homes in markets with annual growth rates of >2% or higher, a clear shift from this time last year.
Looking further ahead, we expect levels of sales inventory to remain below average over 2021 creating a scarcity of homes to buy. There may be some over-hang of stock from the current boom in supply that does not sell but we still see a lack of supply supporting pricing.
Any sustained improvement in the economic outlook that boosts demand would feed into house price growth.
A resilient market but one that needs more liquidity
At the start of 2020, many businesses operating in the housing market were expecting a bumper year as market activity ramped up in the wake of the General Election.
The pandemic put paid to that in the second quarter, but the scale of the rebound has driven a remarkable turnaround. 2021 is set to be a year of transition as the nation continues to adjust to the pandemic and the roll out of vaccines to control the transmission of COVID19 so life can return closer to normal and the economy can continue to recover.
The cost of the pandemic has taken national debt to a record high with taxes set to increase in the years ahead to start to pay down debt.
In the sales market, the long run trend has been one of persistently lower levels of housing sales as a proportion of all private homes. In 2021 we expect just 4.5% of homes to transact, compared to a 60-year average of 7% and a high of 12% in 1988 (a homeowner moving every 8 years).
A combination of demographic, social, policy and economic factors have all acted to reduce the liquidity of the housing market to a level that can’t go much lower in our view.
Housing plays a very important role for the economy as we have seen in 2020. The pandemic has re-enforced the importance of the home to UK households and this will continue to support the market in 2021.
As we emerge from the current crisis it is vital that policy makers focus more on boosting the liquidity of the housing market that can support labour mobility, economic growth and better housing choices for all households.
Housing as a store of wealth, an ageing population and faster growth in older, single person households will all act to shape how the market evolves in the years ahead.
New challenges lie ahead, not least the green energy and low carbon agenda which will be the next big policy impact on the housing market.
While the COVID-19 pandemic may have created a lifetime revaluation of housing, more and faster change will only add to the complexity of how households evaluate their housing requirement, now and into the future.
UK House Price Index – October 2020
By Richard DonnellRelated articles
Sellers need to remain realistic on where they set the asking price if they are to take advantage of improving market conditions to secure a sale and move home in 2024.
After a busy start to 2022, the market will start to move back to pre-pandemic conditions, allowing supply pipelines to rebuild. However, the demand/supply imbalance will not fully unwind, and this will be one factor supporting price growth of 3% next year.
House price growth is starting to ease, although the path over the next year will not be linear. We expect UK average price growth to end 2022 firmly in positive territory at 3%.
The impact of the pandemic has further to run. The current momentum in the market will largely offset growing headwinds over 2022 with average UK house prices increasing by 3% and 1.2m sales.

Subscribe to receive email updates.
HometrackGlobal:
Linked In: