Confirming payment details

Payment processing
Login or Sign up
Forgot password
Enter your email address and we will send you a password reset link or need more help?
UK House Price Index – November 2020
By Richard Donnell on 21 December 2020- Rollercoaster year set to end with demand up 33% compared to December 2019
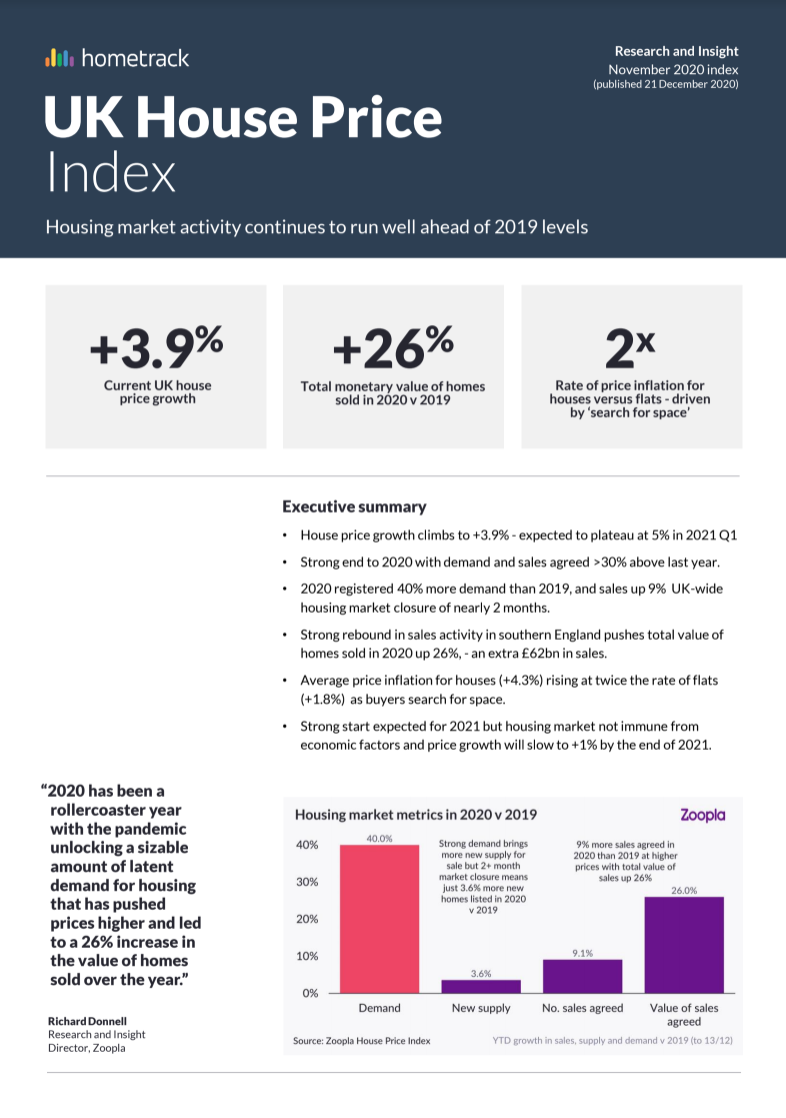
- Pandemic has driven a seismic search for space and quality of location, with 40% more buyers across the whole of 2020 compared to 2019
- More activity at higher price points means the value of homes selling is 26% higher than in 2019
Housing market activity has come full circle in 2020 and will end on a high, despite the two month+ UK market closure borne of the pandemic.
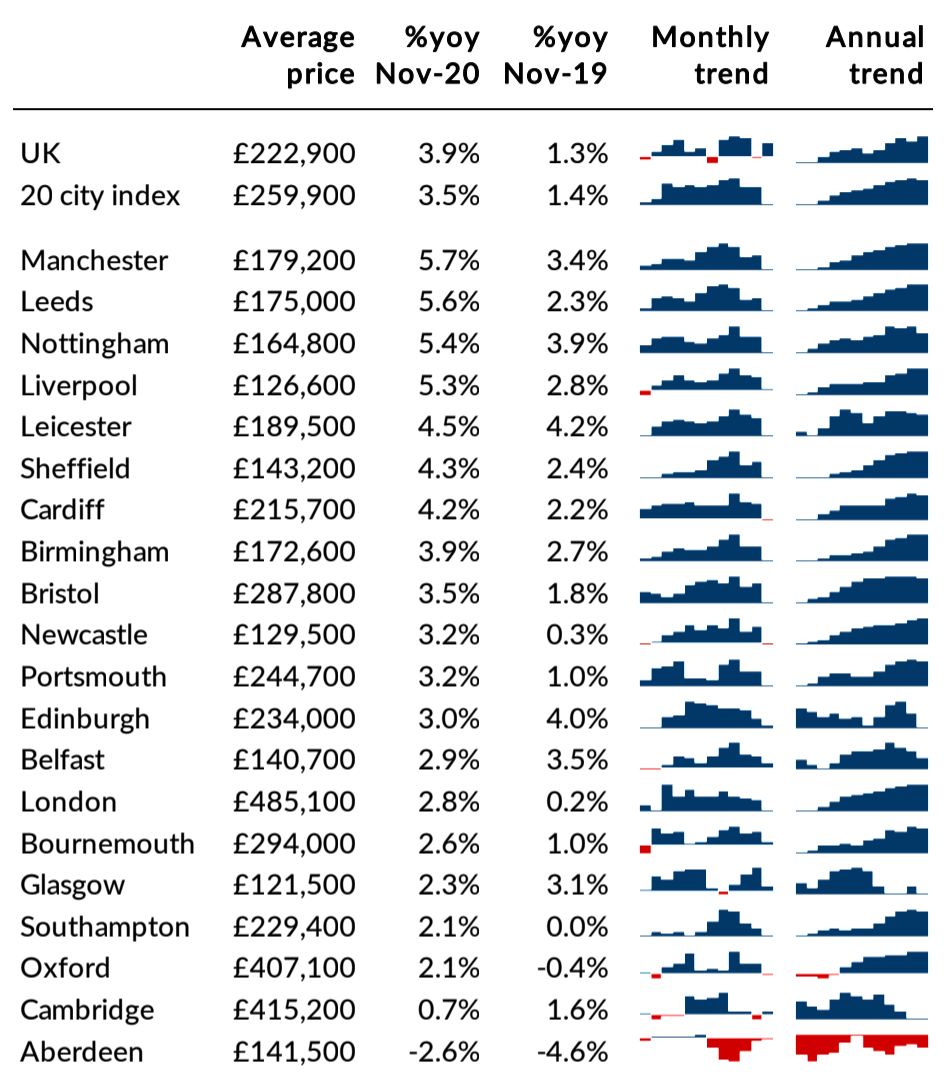
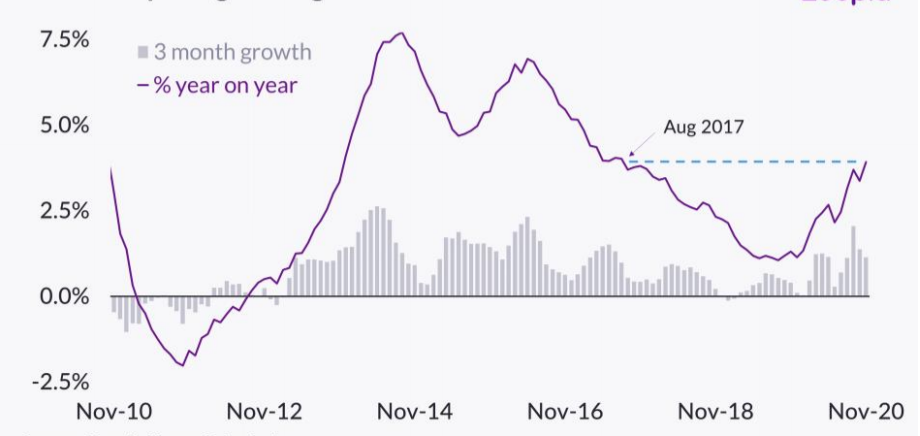
Annual UK house price inflation +3.9%
The annual rate of UK house price growth has moved higher to +3.9% in November, up from +1.3% a year ago. The 3-month growth rate peaked at 2% in September and has slowed, suggesting annual growth will start to plateau at c.5% in 2021 Q1.
The impetus for house price growth is coming from northern England and Wales where affordability remains less of a barrier to price growth. Average prices in the North West are increasing at 5% followed by Wales and Yorkshire and the Humber (both 4.9%).
At a city level, Manchester is registering growth of 5.7% followed by Leeds, Nottingham and Liverpool all recording growth over 5% per annum.
Demand for housing 40% higher over 2020 than 2019
Market conditions remain strong as we move towards the Christmas break. Demand has slowed since the summer but remains 33% higher than a year ago when the General Election impacted levels of activity.
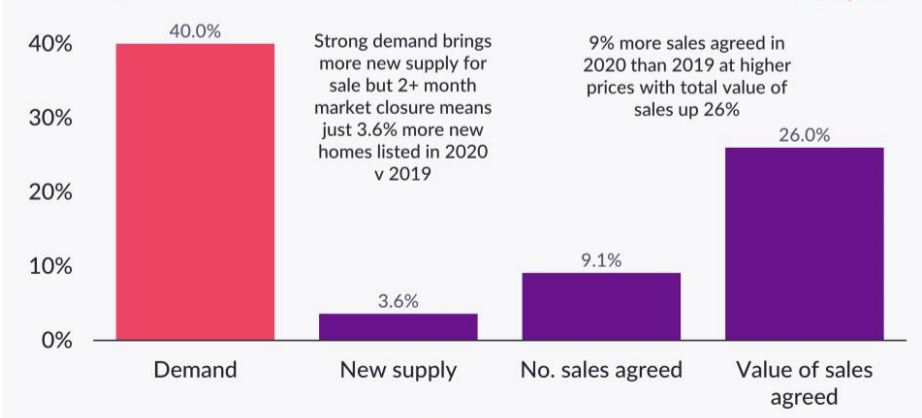
Over the whole of 2020 we have recorded 40% more demand for housing than in 2019. The flow of new supply onto the market has been 4% higher than 2019 and this supply/demand mismatch explains why house price growth is increasing.
South of England leads the recovery in new sales
Sales agreed continue to run ahead of last year by over 40%, in line with above average demand. Over the course of 2020 we have recorded 9% more new sales agreed than in 2019. These sales convert into completions after 3-4 months so a proportion of these new sales will not complete until 2021.
The rebound in sales has been strongest in the South East and Eastern regions where they are more than 20% higher than 2019. Sales agreed have lagged in Scotland, Wales and Northern Ireland as a result of longer market housing market closures than in England over the year.
Value of sales agreed in 2020 is 26% higher than 2019
We have highlighted in previous editions how the COVID crisis has driven a shift in the demographic profile of new sales, with a notable increase in affluent demographics where house prices are higher.
A combination of more sales at higher prices means the total value of residential property that has changed hands in 2020 is 26% higher than last year. This equates to an additional £62bn of sales which takes the annual total value to over £300bn.
This will significantly boost estate agency revenues and explains why the value of mortgage approvals for home purchase in October is 68% higher than a year ago (reflecting sales agreed 2-3 months prior, in the peak of the rebound).
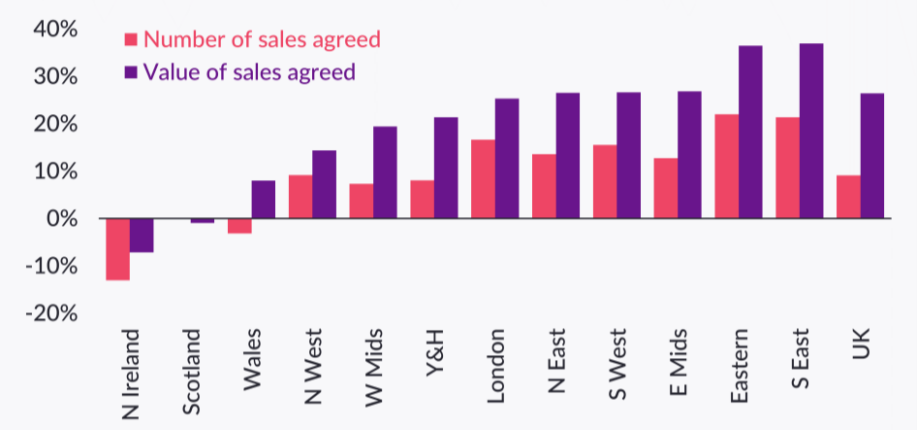
There is a clear relationship between the number and value of sales agreed across regions and countries.
Sales activity in the south of England has been lower than historical averages in recent years, so this year’s bounce-back in activity – coupled with higher average selling prices – means that the total value of homes sold in 2020 in the East of England and the South East is up to 37% higher than in 2019.
Stronger housing market conditions in northern English regions last year, explain why the growth in sales in these areas has been more in line with the national average.
Price growth for houses is more than double that for flats
The search for space has been a key feature of the rebound in market activity as households re-evaluate their housing requirements.
Demand for family housing with gardens, parking and extra space to work from home has continued to rise. For those looking to buy flats, buyers are prioritising homes with private outside space but not all homes can meet this requirement which is then reflected in pricing levels and the time to sell.
Segmenting our house price index by property type shows that the search for space is having an impact on price inflation with houses recording annual price inflation 2x that for flats. There is a spread in growth rates by area but in all cases the rate of growth for flats is lower than for houses.
Strong start to 2021 Q1
As we approach the final two weeks of the year, housing market activity is slowing but remains unseasonably strong. The ‘once in a lifetime re-assessment of housing’ kick-started by the pandemic has further to run in our view.
As households look to the future, and with no immediate end in sight to restrictions, a proportion will continue to re-assess their housing priorities.
Stamp duty is a factor supporting demand, but we have questioned the scale of the importance. A recent consumer survey by Zoopla found that 44% of movers’ plans were not influenced by the stamp duty holiday - they remain focused on the need to relocate and find more space and a better location.
We expect a seasonally strong start to 2021 with older, equity-rich, long-time owning households continuing to take a growing share of sales.
Improved availability of higher loan to value mortgages for those with deposits of 10% or more are already increasing which will support first time buyers in 2021.
With a long Christmas weekend, and many households isolating in smaller groups, we expect interest in housing to be stronger than usual ahead of the traditional Boxing Day bounce when interest in housing jumps and the next tranche of households start planning their next move.
Housing market not immune from economic factors
While market activity is being boosted by latent demand unlocked by the pandemic, the housing market is not immune to economic forces and rising unemployment.
Economic pressures are already impacting in parts of the market, reducing the volume and share of sales in less wealthy areas, for example. Our previous report set out in detail our forecasts for completed sales and house prices over 2021.
We expect house price growth to slow to +1% by the end of 2021 as demand starts to weaken over 2021 H2. The number of completed housing transactions will be buoyed by a strong Q1 with sales agreed over 2020 Q4 completing early next year.
Overall, we expect the number of completed housing transactions to match 2020 levels at 1.1m.
UK House Price Index – November 2020
By Richard DonnellRelated articles
The housing market continues to adjust to higher mortgage rates. Sales volumes are rising and house prices are flat. What the market needs most is continued price stability which will create the environment for continued growth in sales
After a busy start to 2022, the market will start to move back to pre-pandemic conditions, allowing supply pipelines to rebuild. However, the demand/supply imbalance will not fully unwind, and this will be one factor supporting price growth of 3% next year.
House price growth is starting to ease, although the path over the next year will not be linear. We expect UK average price growth to end 2022 firmly in positive territory at 3%.
The impact of the pandemic has further to run. The current momentum in the market will largely offset growing headwinds over 2022 with average UK house prices increasing by 3% and 1.2m sales.

Subscribe to receive email updates.
HometrackGlobal:
Linked In: