Confirming payment details

Payment processing
Login or Sign up
Forgot password
Enter your email address and we will send you a password reset link or need more help?
UK House Price Index – January 2021
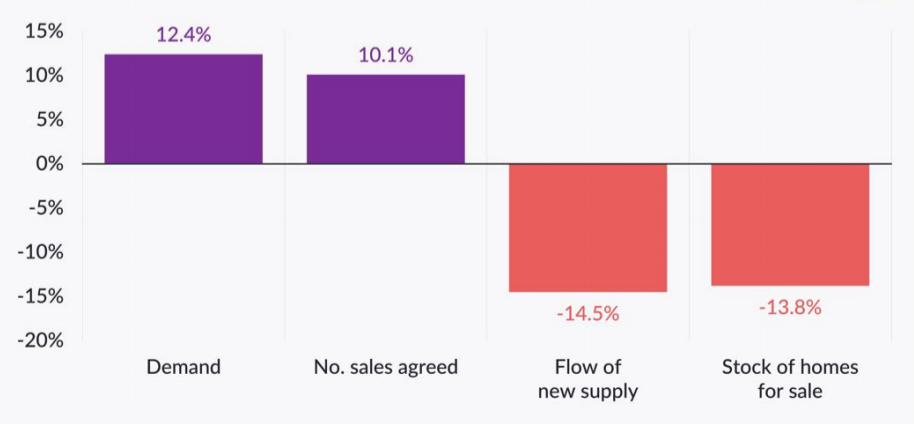
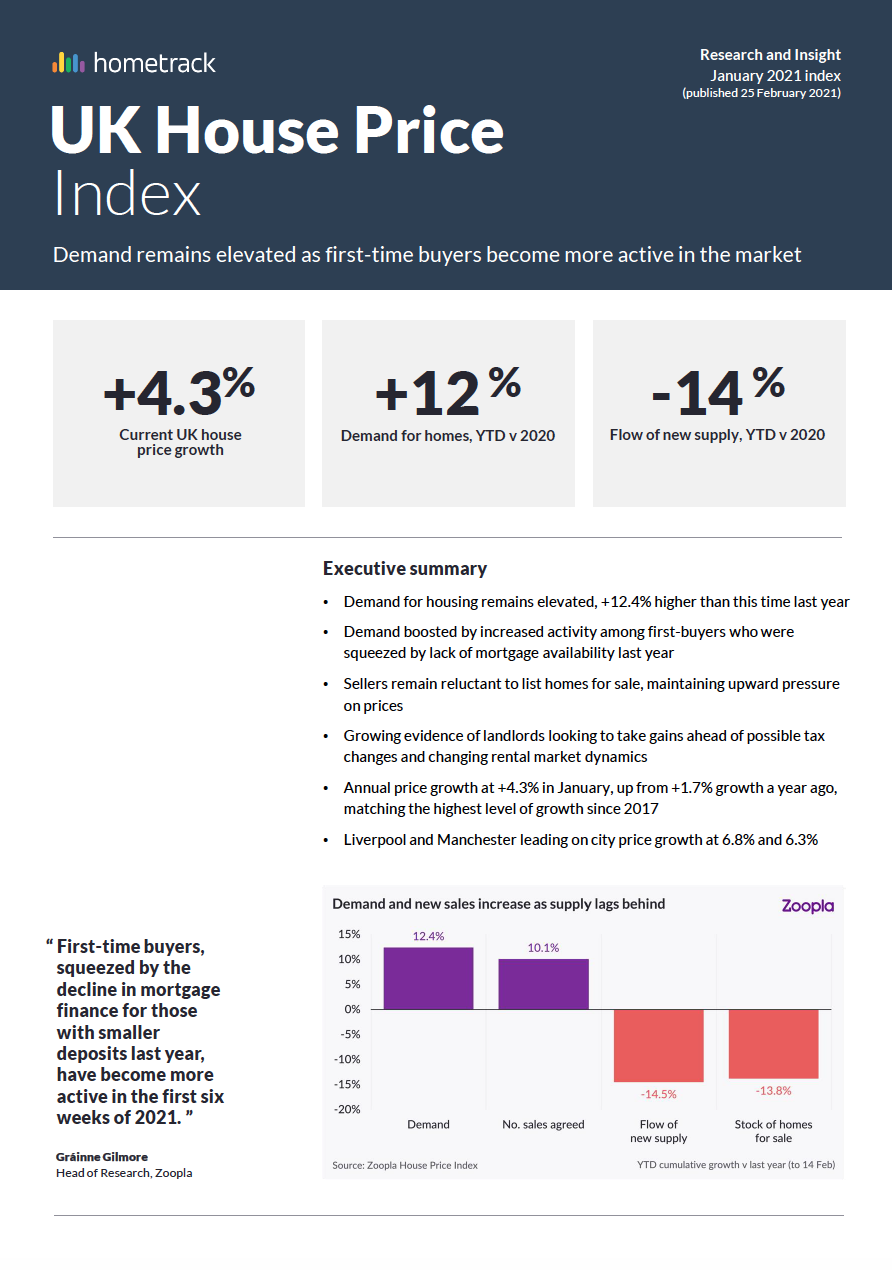
By Richard Donnell on 25 February 2021- Demand for housing remains elevated, +12.4% higher than this time last year
- Demand boosted by increased activity among first-buyers who were squeezed by lack of mortgage availability last year
- Sellers remain reluctant to list homes for sale, maintaining upward pressure on prices
First-time buyers are emerging back into the market after recording a fall in share of sales from their 2018 high, in the wake of 2020’s pandemic-led credit squeeze. As lenders withdrew 90%+ loan-to-value mortgages attempting to de-risk at the onset of the recession, many first-time buyers were forced to put their plans to buy on hold.
Annual UK house price inflation +4.3%
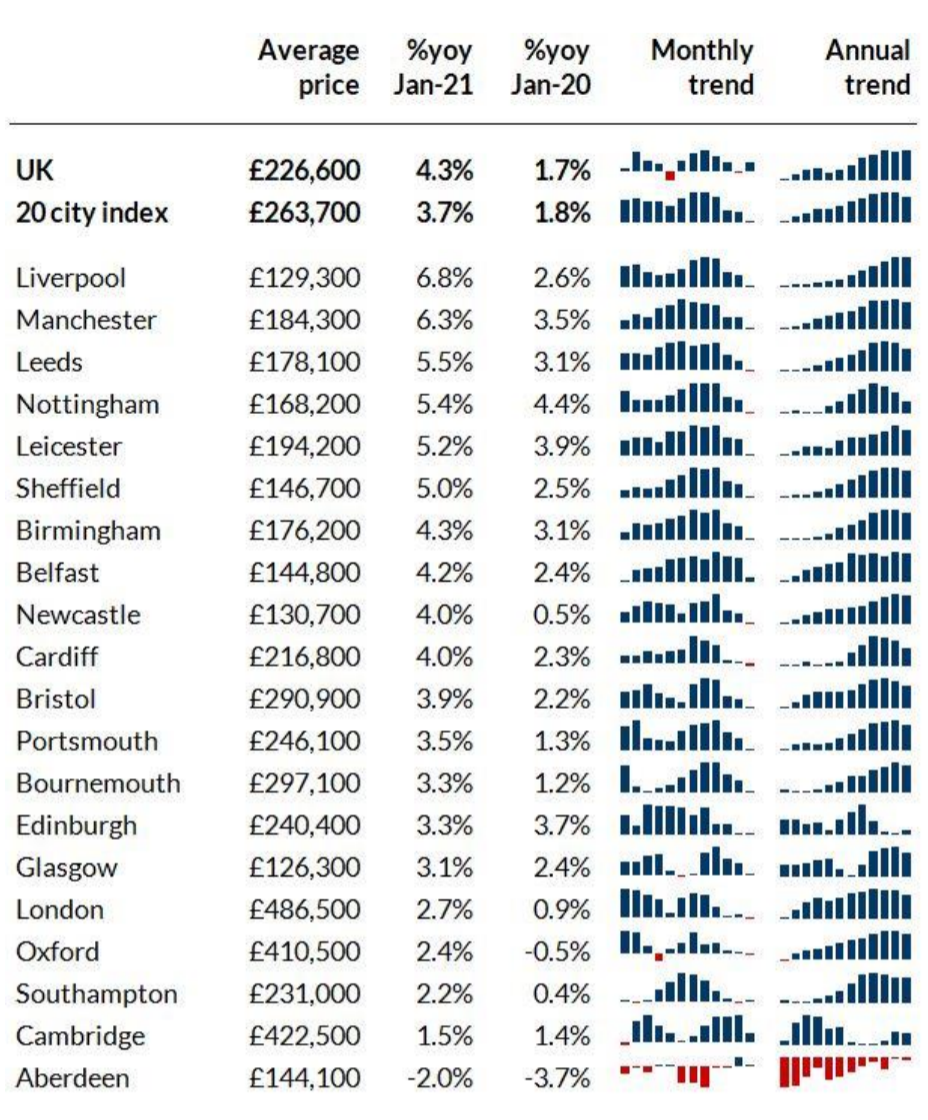
House prices climbed by 0.3% in January, taking the annual rate of growth to 4.3%, matching the highest rate of growth since April 2017.
Price growth at a country and regional level ranges from 2.8% in London to 5.5% in the North West of England and 5.6% in Wales. Meanwhile Manchester and Liverpool are the cities registering the strongest price rises, with annual house price growth of 6.3% and 6.8% respectively.
Demand for housing still ahead of last year
Buyer demand has remained strong through the first six weeks of 2021. It is up 12.4% compared to the same point last year - when demand rebounded after the General Election result in December 2019.
The flow of new buyers comes despite the imminent ending of the stamp duty holiday. Robust levels of demand signals the continuation of a trend that we have highlighted since the summer last year.
While stamp duty has prompted higher levels of activity, there is still a cohort of buyers and movers who are looking for a new home after a reassessment of how and where they are living after repeated lockdowns, and the rise of working from home. The data points towards a ‘search for space’ among some buyers.
As demand remains high, the number of homes being listed for sale is not keeping pace, putting sustained upward pressure on pricing. There are two reasons why new supply is currently constrained.
As we highlighted at the start of the year, some sellers are pressing pause on inviting potential buyers into their homes for viewings during the current lockdown. We expect the flow of new supply to speed up once lockdowns ease.
The data also signals a second factor emerging; increased demand from first-time buyers who have no property to sell when they move.
Regional imbalances
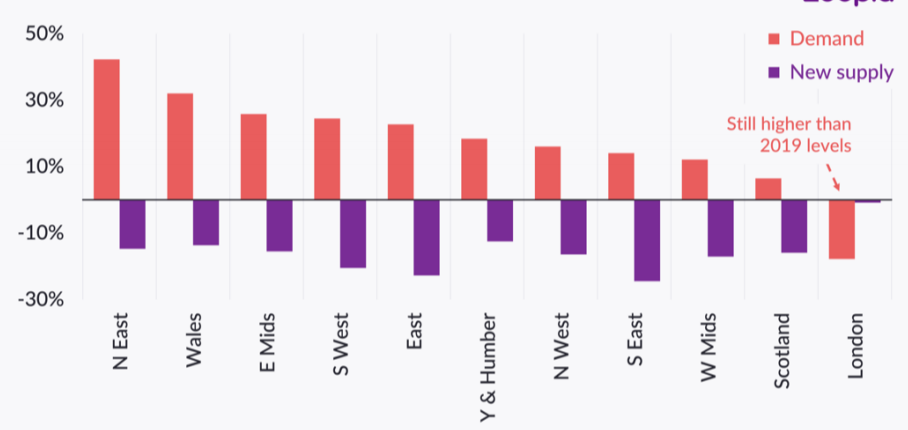
The mismatch between supply and demand is still evident in most regions across the country, as shown in the chart below. Demand levels in the North East are running more than 40% higher so far this year than over the same period last year, while new supply has shrunk.
The exception is London, where demand levels have fallen year-on-year. However, there is a caveat here. Demand levels in London may be down 17% on an annual basis, but this is compared to a period in 2020 when there was a major surge in activity after the election result in December 2019 with activity levels rising off a relatively lower base.
If we compare current London demand figures to previous years, they are still well ahead of the average. Supply in London is also not as constrained as other markets, reflecting a higher proportion of landlords selling their property.
Early evidence of increased first-time buyer activity
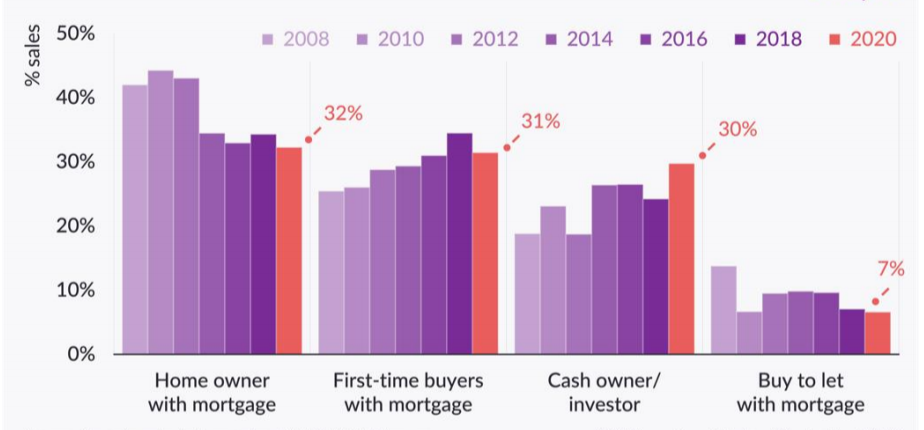
Last year, amid a squeeze on mortgage availability for those with smaller deposits, we saw the share of first-time buyers fall to the lowest level in four years.
Those buying with a mortgage made up the largest share of activity, while there was a sharp rise in those buying in a cash transaction - signalling rising activity among homeowners using equity to make their next move.
As we move into 2021 however, there are signs of increasing activity among first-time buyers. Our data shows that buyer demand from first-time buyers across the UK is up 5% in the first six weeks of the year compared to Q4.
This chimes with an increased array of mortgages available for those with only a 5% or 10% deposit. While mortgage lending levels in this sector are not nearly back to where they were in early 2020, the number of lenders offering such deals has risen since Q4 last year.
We have also registered an increase in the number of sales agreed between £100,000 and £250,000, which climbed by 18% in the first seven weeks of the year.
Buyers of lower-value properties tend to be more reliant on the availability of mortgage finance, especially at higher loan-to-values, and the return of activity in these price bands suggests a return to the market of purchasers who struggled to get finance in 2020.
This activity among first-time buyers will also be sustained beyond March 31st as most first-time buyers will not be affected by the end of the stamp duty holiday.
Typically, some 78% of first-time buyers purchasing a property worth up to £500,000 pay no stamp duty. Yet as more first-time buyers enter the market, it is likely to further exacerbate the imbalance between supply and demand in many parts of the market, as first-time buyers do not have a home to list for sale.
Are some landlords looking to take gains?
Many first-time buyers will be entering the sales market from the rental market. And we are seeing some supply coming from this sector as landlords put homes up for sale.
The proportion of homes listed for sale in each region which have previously been rented out has risen during 2020. This is most notable in London, where 13% of homes being listed for sale in Q4 2020 were previously rented.
Landlords are reassessing their portfolios for several reasons. Firstly, there has been increasing discussion about a potential rise in capital gains tax for those selling additional properties.
The Government asked the Office of Tax Simplification (OTS) to examine capital gains tax in summer last year, and the OTS reported its findings in November.
This may be prompting some landlords to crystallise capital gains before any new rules might be implemented. There is widespread speculation capital gains tax changes could be implemented as part of a wider post-COVID package in the Budget on March 3rd.
Secondly, some landlords are reacting to current conditions in the rental market with negative pressure on rents in some city centres.
Finally, the more buoyant sales market may be prompting some landlords to take action. This is a material trend given the constrained supply of homes for sale in the market at present.
However, in the wider context of the private rented sector, it is still a small movement. The rented homes being put up for sale in the second half of 2020 account for less than 1% of private rented sector stock.
Outlook
The data points towards sustained buyer demand throughout Q1 as pent-up activity among first-time buyers is released amid a noticeable step up in availability of low-deposit mortgage finance.
The ‘search for space’ among existing homeowners is set to continue, especially in light of the current sustained lockdown. Sales are still being driven by homeowners deciding that they want to live in a larger home, or a home with more outside space.
Others are being motivated by the opportunity to live in a different location due to the rise in working from home. Although offices will re-open when COVID-19 restrictions allow, the pendulum is unlikely to swing fully back to 5-days a week in the office for all UK office-based workers.
As the vaccine roll-out continues to gather momentum, and COVID-19 cases start to recede, we also expect more demand from the sellers who have currently pressed pause on inviting buyers into their homes.
Increased confidence around the UK’s response to the pandemic, and opening up of the economy, will likely mean a resumption of activity among these sellers.
This in turn will create additional demand as they start to plan their next move. All of these factors will support activity into the middle of 2021. We still expect house price growth to ease as we move through H2 in more challenging economic conditions, ending the year at +1%.
UK House Price Index – January 2021
By Richard DonnellRelated articles
The housing market continues to adjust to higher mortgage rates. Sales volumes are rising and house prices are flat. What the market needs most is continued price stability which will create the environment for continued growth in sales
After a busy start to 2022, the market will start to move back to pre-pandemic conditions, allowing supply pipelines to rebuild. However, the demand/supply imbalance will not fully unwind, and this will be one factor supporting price growth of 3% next year.
House price growth is starting to ease, although the path over the next year will not be linear. We expect UK average price growth to end 2022 firmly in positive territory at 3%.
The impact of the pandemic has further to run. The current momentum in the market will largely offset growing headwinds over 2022 with average UK house prices increasing by 3% and 1.2m sales.

Subscribe to receive email updates.
HometrackGlobal:
Linked In: