Confirming payment details

Payment processing
Login or Sign up
Forgot password
Enter your email address and we will send you a password reset link or need more help?
UK House Price Index – April 2021
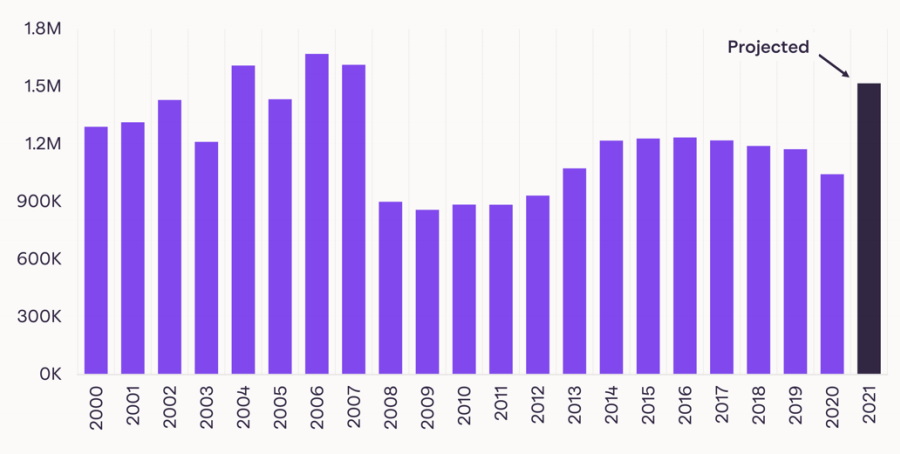
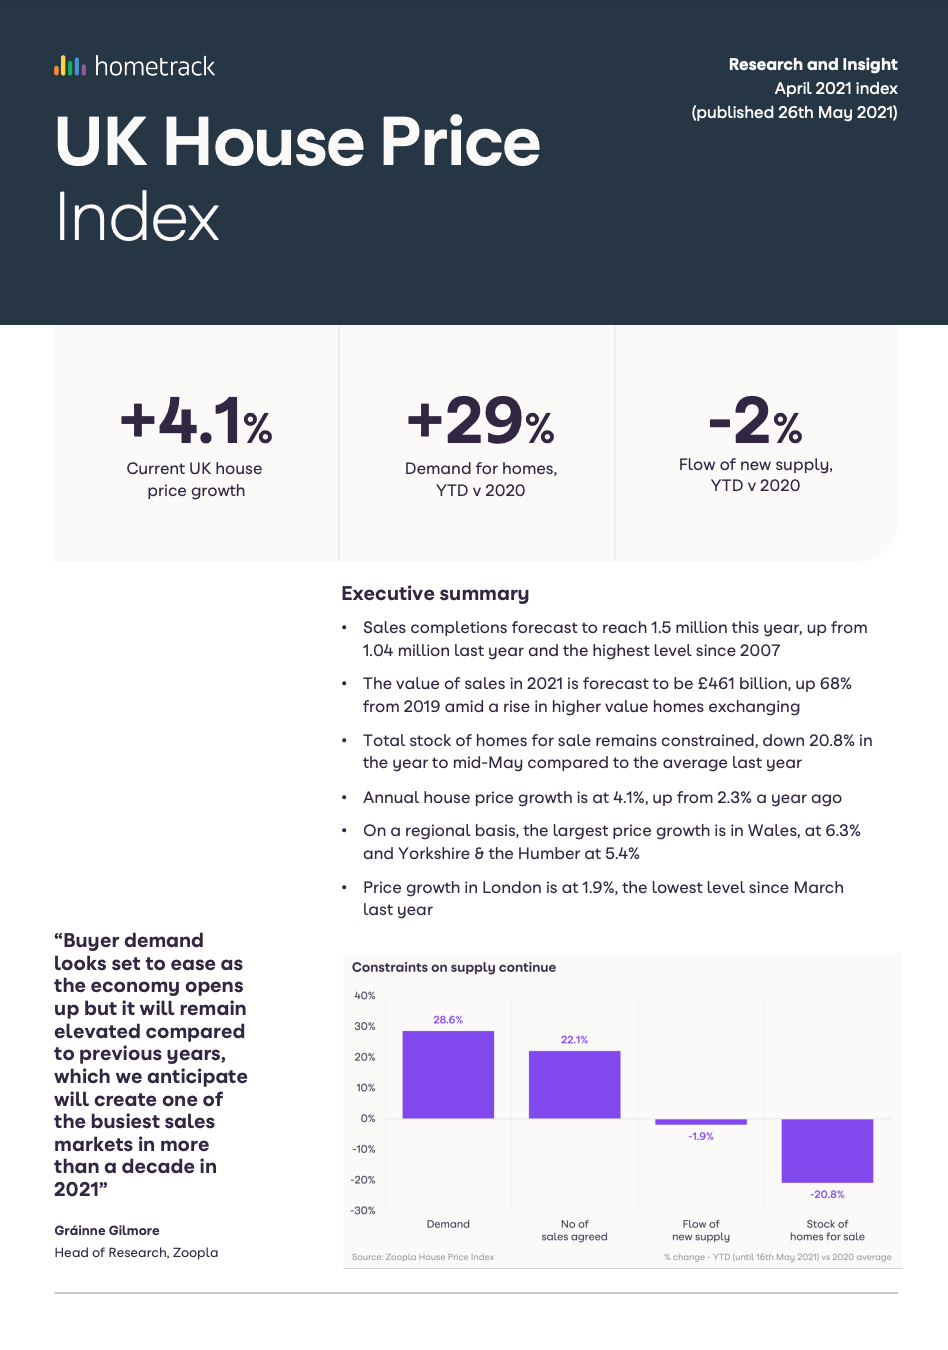
By Richard Donnell on 26 May 2021- Sales completions forecast to reach 1.5 million this year, up from 1.04 million last year and the highest level since 2007
- The value of sales in 2021 is forecast to be £461 billion, up 68% from 2019 amid a rise in higher value homes exchanging
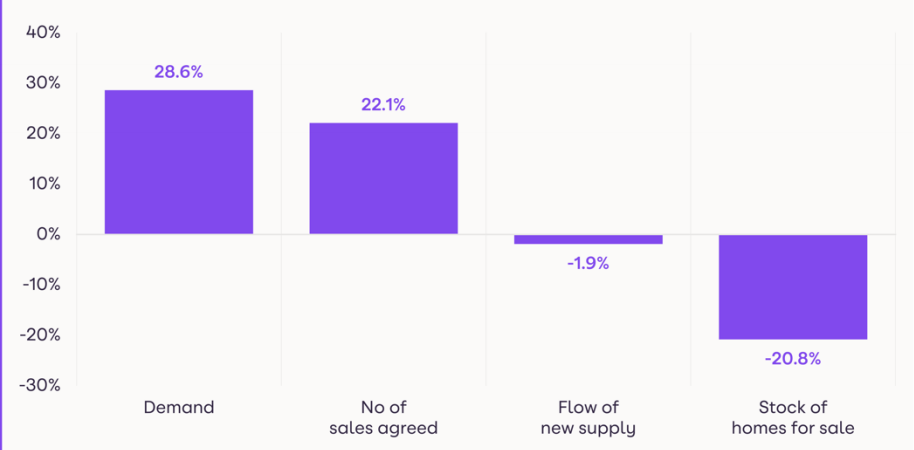
- Total stock of homes for sale remains constrained, down 20.8% in the year to mid-May compared to the average last year
Buyer demand looks set to ease as the economy opens up but it will remain elevated compared to previous years, which we anticipate will create one of the busiest sales markets in more than a decade in 2021
Annual UK house price inflation at +4.1%
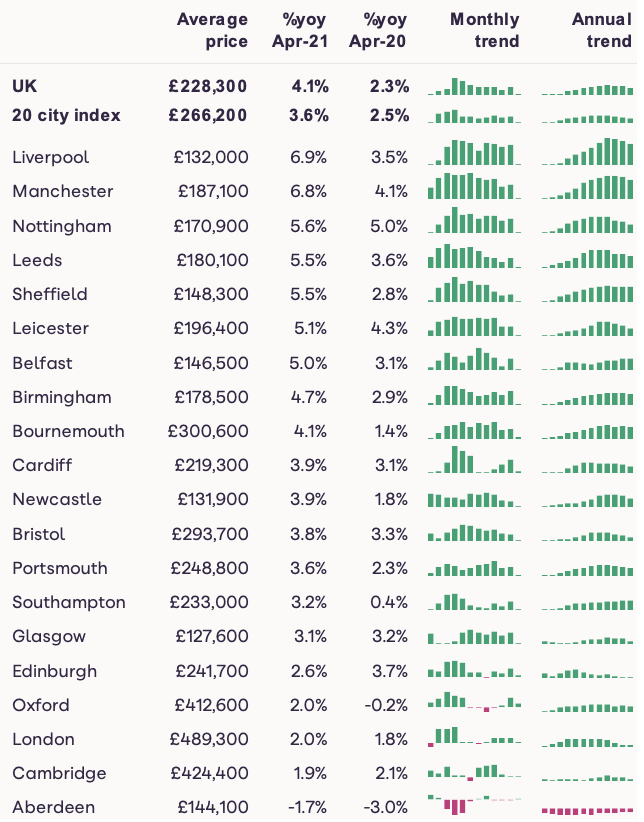
Average house prices rose at 4.1% in the year to April, up from 2.3% in April last year, but down from 4.7% at the start of the year.
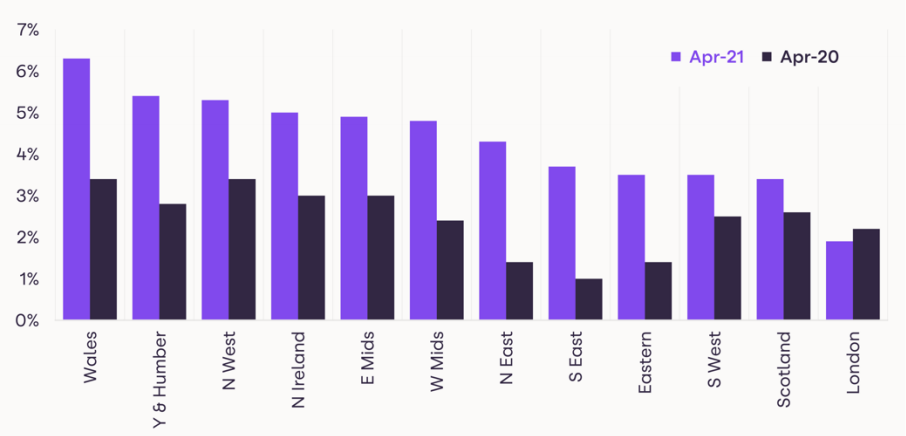
Prices are being underpinned by demand from buyers continuing to outstrip supply. Price growth is highest in areas where affordability is greatest.
In the year to April, average prices in Wales rose by 6.3%, followed by Yorkshire & the Humber where prices rose by 5.4%.
London continues to trail when it comes to price growth, at 1.9%, the slowest regional rate of growth across the UK for the sixth consecutive month.
On a city level, Liverpool (+6.9%) and Manchester (+6.8%) are registering the highest price growth of major cities monitored in this report, the fifth consecutive months this has been the case.
This level of price growth comes as buyer demand in these cities in April was running at twice the levels than in more ‘normal’ market conditions between 2017 and 2019, amid a 10+% decline in the homes available to buy.
Across the UK, the demand for family houses continues to put upwards pressure on this type of home, with average values for houses up +5.2% on the year, compared to +1.1% growth for flats.
Sales completions forecast to rise to 1.5 million
Buyer demand has been strong since the end of the first lockdown last year as households reassess how and where they are living. For some, the need for more space, especially if working from home is to be a more regular occurrence, has prompted a move.
Many older households are also re-evaluating their housing needs and moving for the first time in many years. First-time buyers are also becoming more active in the market, with better access to mortgage finance.
The stamp duty holiday introduced in July to March, and the subsequent extension to June and tapered extension and the end of September, has provided an added impetus for many to purchase a home.
This demand for homes in the sales market led to a very busy start to the year (as examined in March house price index report) with £149 billion of homes sold subject to contract in the first 15 weeks of the year.
We expect that activity will remain elevated in H2, albeit not as high as towards the end of last year. Even so, we expect total sales completions this year will be 1.52 million.
This would mark 2021 as the one of the most active sales markets since the global financial crisis, and as one of the top ten busiest years since 1959.
Our projections also show that the value of homes sold this year will be £461 billion, some 46% higher than last year, and 68% higher than in 2019.
Since the market opened up last year, the ‘search for space’ has contributed a rise in the value of homes being sold.
This, as well as added activity, has led to a rise in the total value of sales from £273 billion in 2019, to £316 billion in 2020 and a projected total of £461 billion in 2021 – boosting revenue pools for agents.
In turn, the value of mortgage lending is also rising, hitting a record high of £11.3 billion in March, according to the Bank of England.
The hottest and coldest markets
Wales, Yorkshire & the Humber and the North West are the regional markets registering the highest price growth.
They are arguably also the ‘hottest’ regional markets at present – as these markets are also among those where the market is moving more quickly than the ‘normal’ market conditions in 2017-2019.
The time between a listing a property and securing a sale subject to contract (SSTC) has fallen by between 10-15 days in the North West, Wales and Yorkshire & the Humber, and this is accompanied by the highest levels of price growth.
At the other end of the scale, homes are taking just under two months to sell in inner London, two weeks longer than the 2017-2019 average, making it a relatively cooler market.
Annual price growth is also lagging at +0.3% on the year. Four central London boroughs are registering price falls for the third or fourth consecutive month, including the City of London (prices down -2.5% year on year), Westminster (-2.2%), Kensington & Chelsea (-1.7%) and Hammersmith & Fulham (-1.4%).
London is a global real estate market, and these areas have been particularly affected by the global shutdown of international business and leisure travel due to the pandemic.
Affordability constraints also remain a drag on the wider London market. The ‘hottest’ city markets, were homes are being sold more quickly and price growth is strongest include Wigan, Blackburn and Burnley where time to sell is down by three weeks or more, and annual price growth is at least 5.8%.
Five of the 65 cities monitored for this report have registered an increase in time to sell. Sales are taking longer in Aldershot (+1 day) Southampton (+1 day), Gloucester (+2 days), Edinburgh (+2 days) and Coventry (+8 days) bucking the wider trend of faster moving markets. However annual price growth remains positive in all these cities.
Market outlook
Demand levels have moderated since the peak in Q1 as the economy opens up and life starts to return to some sort of ‘normal’.
As lockdowns continue to ease, demand levels will continue to fall back, but we expect they will remain elevated compared to more ‘normal market’ levels, measured between 2017 and 2019, throughout the rest of this year.
While the introduction of the stamp duty holiday has certainly boosted activity, we believe the once-in-a-generation ‘reassessment of home’ has further to run, a view a member of the Bank of England’s MPC also shared in a speech last week.
The easing of lockdowns will cause a natural fall in demand as people are able to see family and enjoy amenities that have been shut for more than a year, new buyer demand will still emerge throughout H2 as office-based workplaces confirm if they will be pursuing more flexible working practices.
Households who have the opportunity to commute less frequently have more options when it comes to choosing where to live, and this could prompt a move.
Likewise, older households will continue to review how and where they are living, with many more set to move for the first time in years.
With an increased array of mortgages to choose from, first-time buyers will also remain active in the market. At the same time, supply constraints will continue underpin pricing.
The lack of supply is expected to hamper potential sales during this year, yet even so, we expect total transactions this year to rise to 1.5 million, marking one of the busiest years in the UK’s residential market in more than a decade.
UK House Price Index – April 2021
By Richard DonnellRelated articles
Sellers need to remain realistic on where they set the asking price if they are to take advantage of improving market conditions to secure a sale and move home in 2024.
After a busy start to 2022, the market will start to move back to pre-pandemic conditions, allowing supply pipelines to rebuild. However, the demand/supply imbalance will not fully unwind, and this will be one factor supporting price growth of 3% next year.
House price growth is starting to ease, although the path over the next year will not be linear. We expect UK average price growth to end 2022 firmly in positive territory at 3%.
The impact of the pandemic has further to run. The current momentum in the market will largely offset growing headwinds over 2022 with average UK house prices increasing by 3% and 1.2m sales.

Subscribe to receive email updates.
HometrackGlobal:
Linked In: