Confirming payment details

Payment processing
Login or Sign up
Forgot password
Enter your email address and we will send you a password reset link or need more help?
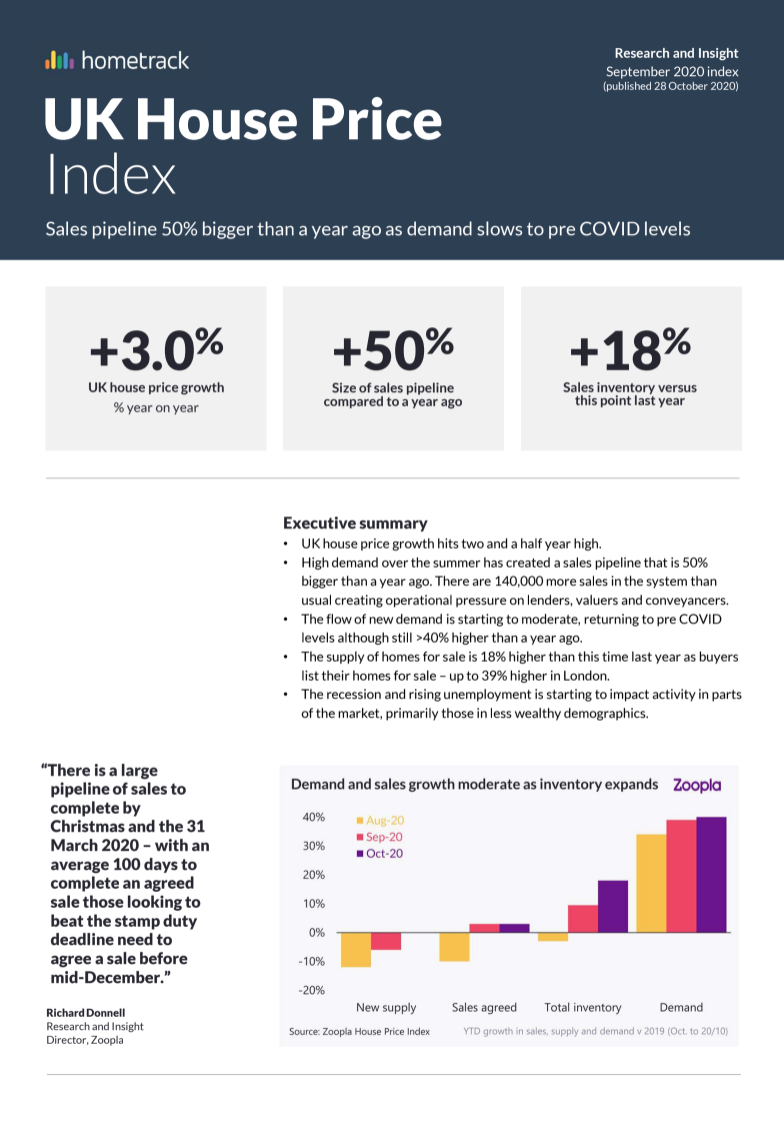
UK House Price Index – September 2020
By Richard Donnell on 28 October 2020- UK house price growth hits two-and-a-half-year high
- High demand over the summer has created a sales pipeline that is 50% bigger than a year ago. There are 140,000 more sales in the system than usual creating operational pressure on lenders, valuers and conveyancers
- The flow of new demand is starting to moderate, returning to pre-COVID-19 levels, although still > 40% higher than a year ago
A total of 418,000 properties worth £112 billion are currently progressing through the sales pipeline, amounting to a 50% uptick in volume compared to the same period in 2019.
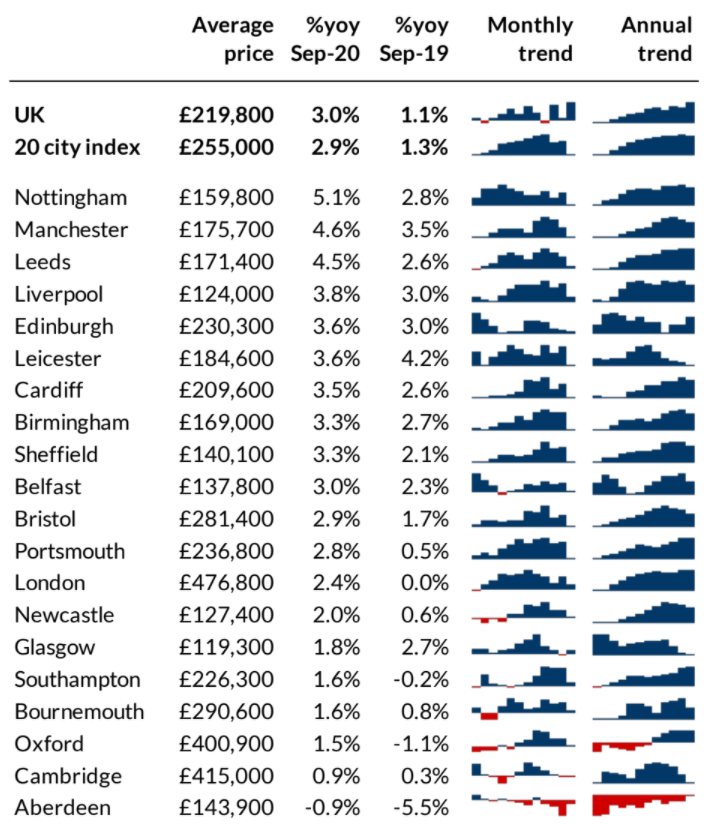
Annual UK house price inflation +3.0%
High demand for housing in the summer is translating into higher house price growth. The UK growth rate is +3.0%, up from +1.1% a year ago - the highest rate for over 2 years (April 2018).
At a region and country level, house price growth ranges from +1.7% in the North East to +3.9% in Yorkshire and the Humber – see map in the full report.
At a city level Nottingham is registering growth of +5.1% followed by Manchester (+4.6%) and Leeds (+4.5%). We expect the headline rate of house price growth to continue to trend upwards over the next 2-3 months towards +4% by the year end.
Sales pipeline 50% bigger than this time last year
There are 50% more homes progressing through the system than this time last year – we estimate there are 418,000 sales progressing to completion worth £112bn. This is 140,000 more sales than usual at this time of year.
This sizeable pipeline of business is a result of new sales agreed since June being 40-60% higher than the same month in 2019. The volume of business trying to complete before Christmas, and the end of 2021 Q1 is creating operational pressures on agents, lenders, valuers and conveyancers.
Agree a sale by Christmas to complete in Q1
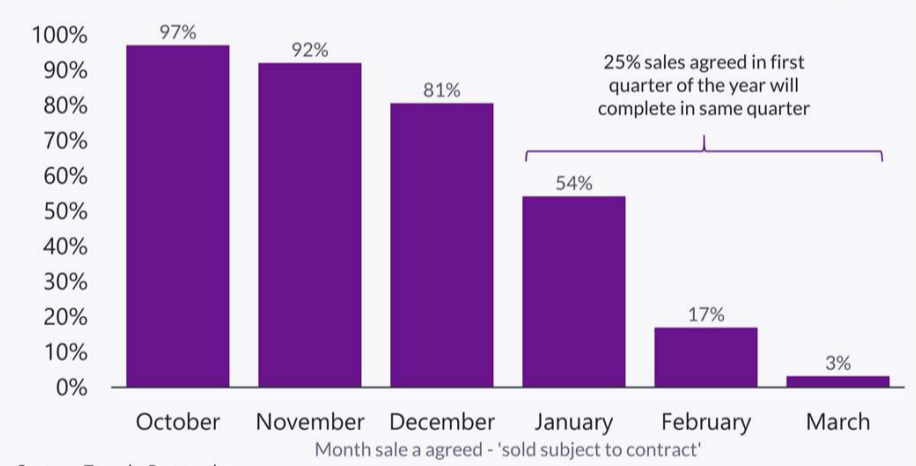
The time between agreeing a sale and completion averages just under 100 days over the last 3 years. The volume of business in the pipeline means this period is likely to increase which buyers need to factor into their decision making.
Most sales agreed in the final quarter of a calendar year will complete by the end of the first quarter of the next under normal market conditions. However, 54% of sales agreed in January will complete by the end of the first quarter, falling to less than a fifth in February.
Given these timelines, we expect committed ‘in market’ movers look to agree a sale by Christmas with a view to completing by the end of Q1 2021, supporting new sales volumes over the rest of this year.
Those buyers that leave it late to January will need to be well prepared and if they have a house to sell, they should find an agent well before Christmas and instruct a conveyancer to get as much paperwork together as possible to boost the chances of a sale.
How much is the stamp duty holiday deadline driving demand?
Many businesses are focused on how the stamp duty deadline may impact business volumes over the first half of next year. With just 25% of sales agreed in Q1 completing in Q1 this implies that buyers who are primarily motivated by savings on the stamp duty holiday will be fewer in numbers after January 2021 impacting housing demand ahead of the stamp duty holiday ending.
Stamp duty changes always distort market volumes to some degree and the scale will depend upon how much buyer activity is driven by the change. We believe that the ‘once in a lifetime re-evaluation of housing’, in response to COVID-19, has been a greater underlying driver of demand with stamp duty savings more of an ‘added bonus’ from completing a sale before next April.
In our view, the latent demand for housing that has been unlocked by COVID-19, especially among older homeowners, has the potential to run into 2021.
Rebound in sale volumes greatest in southern regions
Since the start of 2020, total new sales agreed are 3% ahead of the same point last year. This is despite the lockdown and temporary closure of the housing market over the spring.
Sales volumes are greater than this time last year across southern regions led by the South East, London and the East of England where transactions have rebounded off a lower base. In contrast, Wales and Scotland had a longer market closure than England and year to date sales still lag last year.
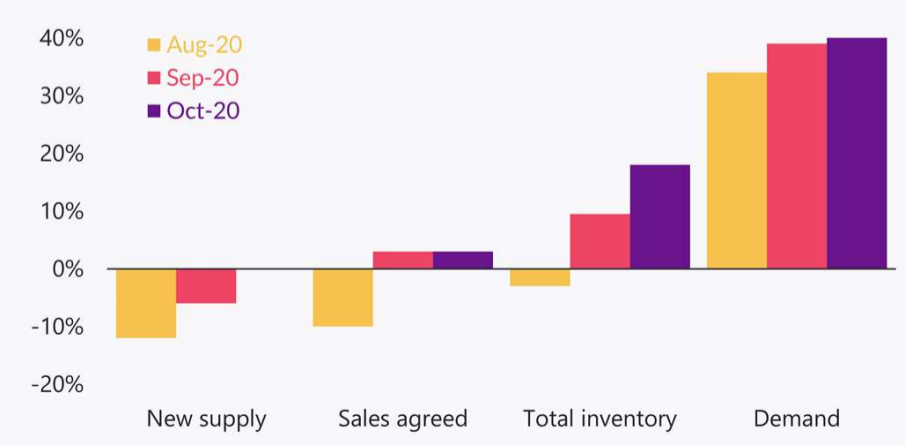
Levels of demand moderating off a high base
Sales volumes lag demand which continues to moderate. This is to be expected given 1) the sheer scale of new buyer interest over the summer and 2) what is typically the start of a slower period for new buyers entering the market.
New buyer enquiries over the last two weeks have slowed to pre-COVID-19 levels but remain 46% higher than a year ago.
Sales inventory 18% higher than a year ago
More buyers in the market means an increase in the supply of homes for sale. Levels of sales inventory are currently 18% higher than a year ago across Britain.
The growth in supply compared to last year is below average in northern regions where market conditions remained stronger over 2019 with decent levels of stock availability.
In London, available inventory is currently 39% higher than a year ago as stronger market conditions bring more sellers into the market after a prolonged period of weaker sales volumes and price falls over 2018-2019.
More supply brings greater choice for buyers and will act to keep house price growth in check. Much of this supply is also at higher average sales prices than a year ago creating something of a risk to future sales volumes should demand weaken materially in the first half of 2021.
Headline measures mask increasingly polarised market
While national measures of housing market activity point to strong market conditions, the picture is far from uniform across the country.
The housing market is not immune from economic pressures resulting from COVID-19. The recession and rising unemployment is impacting parts of the housing market, but this is being masked by strong market conditions in other areas.
An analysis of where new sales have been agreed over the last 2 months cut by the demographic profile of households in the local market (using CACI’s ACORN profiling system) shows a clear shift.
Growing economic uncertainty and reduced credit availability mean a relative decline in the share of new sales being recorded in less wealthy demographics where households are more sensitive to changes in the economic outlook and the availability, pricing and terms for credit.
In contrast we have seen an increase in new sales in areas with wealthier demographics where home-owners have been less directly impacted by the recession so far.
This changing mix of sales mirrors the trends immediately after the global financial crisis with more movement amongst existing owners with larger homes. There is also a correlation with more sales and movement among households in southern England.
We believe this polarisation in market activity is likely to become more apparent by mid-2021, after the post-lockdown rush has worked its way through the system.
Strong end to the year but uncertainty over 2021 outlook
Levels of housing market activity are slowly becoming less frantic as we approach the year end. There is a sizeable pipeline of business for the industry to convert into completed sales and fee income.
The stamp duty deadline will focus the minds of committed movers in the near term and make for a strong first quarter of sales completions in 2021.
The outlook for the remainder of 2021 is less certain and we consider the outlook for the year ahead in more detail in next month’s index report.

UK House Price Index – September 2020
By Richard DonnellRelated articles
Sellers need to remain realistic on where they set the asking price if they are to take advantage of improving market conditions to secure a sale and move home in 2024.
After a busy start to 2022, the market will start to move back to pre-pandemic conditions, allowing supply pipelines to rebuild. However, the demand/supply imbalance will not fully unwind, and this will be one factor supporting price growth of 3% next year.
House price growth is starting to ease, although the path over the next year will not be linear. We expect UK average price growth to end 2022 firmly in positive territory at 3%.
The impact of the pandemic has further to run. The current momentum in the market will largely offset growing headwinds over 2022 with average UK house prices increasing by 3% and 1.2m sales.

Subscribe to receive email updates.
HometrackGlobal:
Linked In: