Confirming payment details

Payment processing
Login or Sign up
Forgot password
Enter your email address and we will send you a password reset link or need more help?
UK House Price Index – March 2021
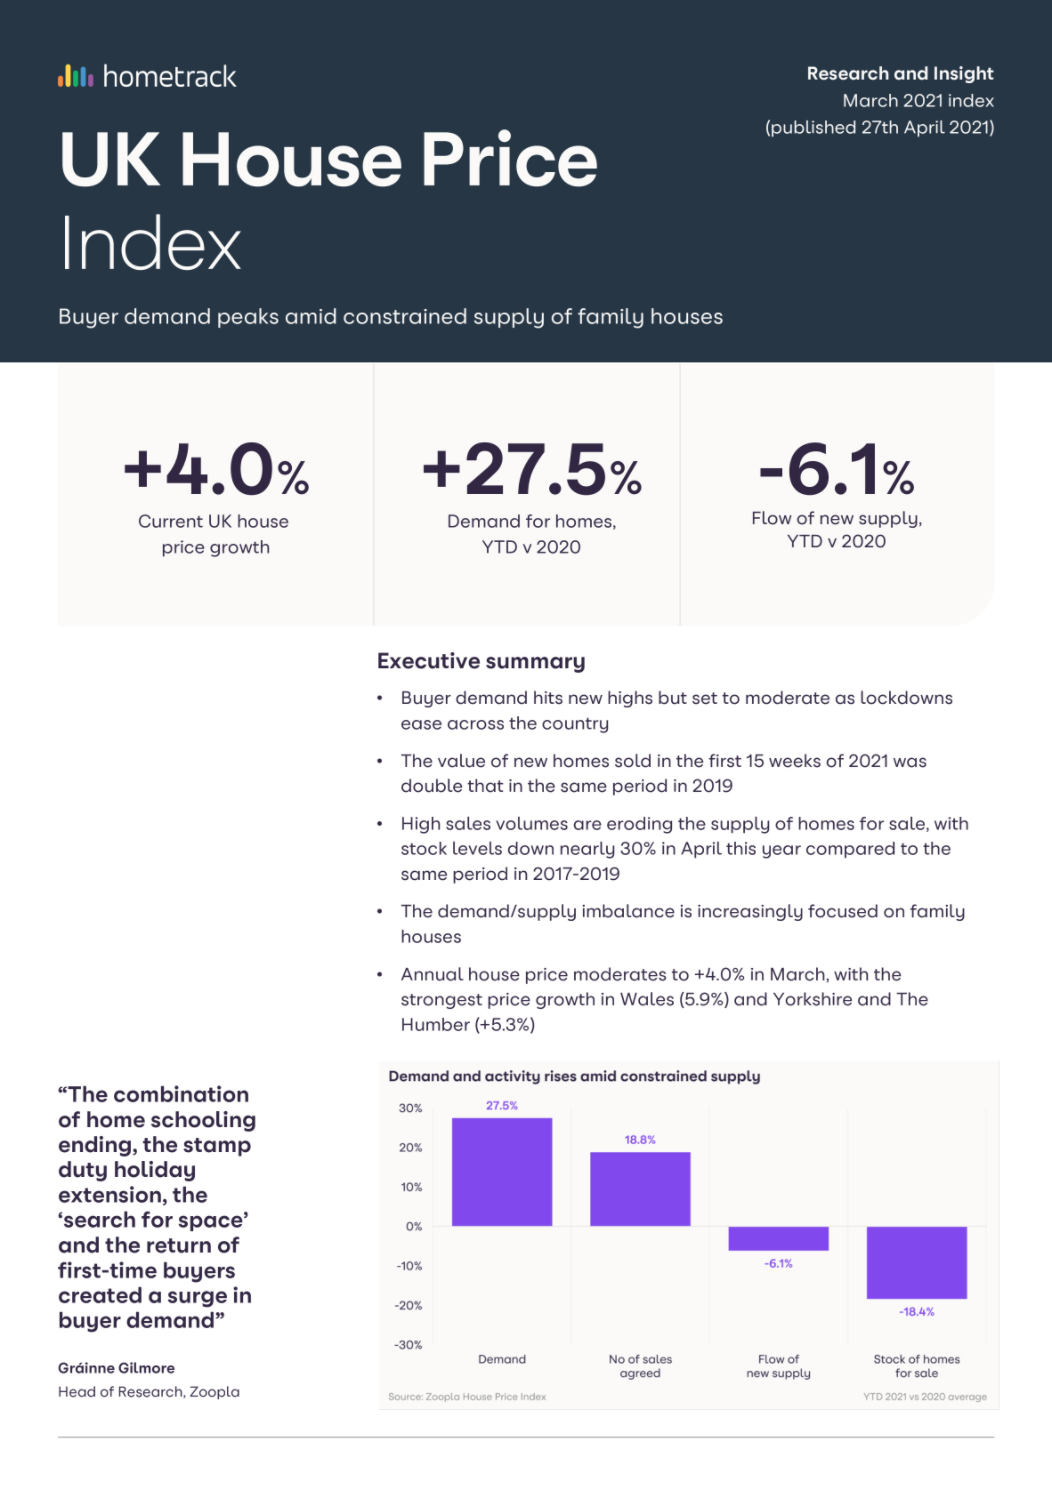
By Richard Donnell on 27 April 2021- Buyer demand hits new highs but set to moderate as lockdowns ease across the country
- The value of new homes sold in the first 15 weeks of 2021 was double that in the same period in 2019
- High sales volumes are eroding the supply of homes for sale, with stock levels down nearly 30% in April this year compared to the same period in 2017-2019
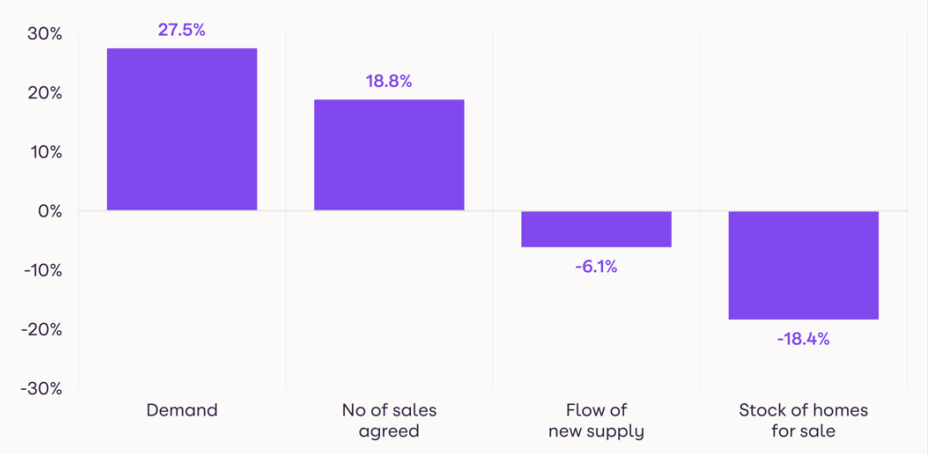
Buyer demand peaks amid supply squeeze for family houses
Demand for homes hits new highs
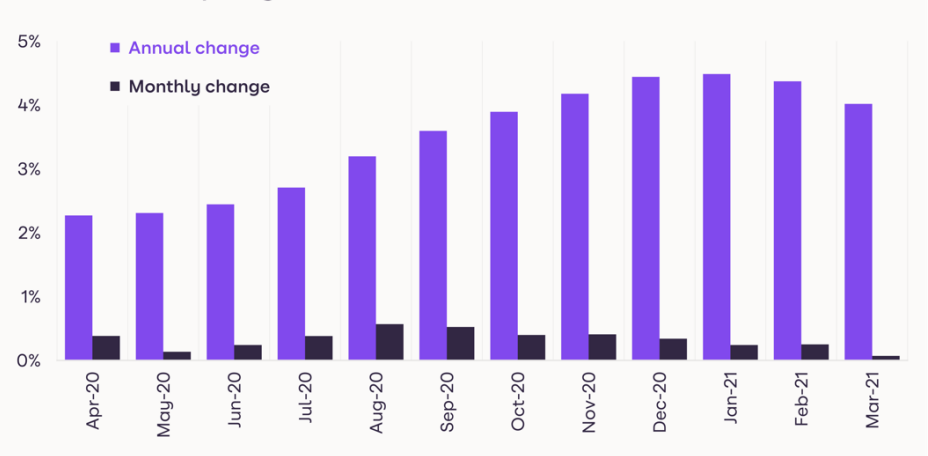
House prices have been rising at an annual rate of 4% or more for five months, although March marks the slowest rate of growth
October 2020.
Price growth is down from 4.5% in January. High levels of demand which are not being matched by supply will continue to support pricing, but the annual rate of price growth will continue to ease as these extreme imbalances start to unwind.
Zoopla’s house price index is stock-weighted, rather than transaction-based, so, in effect, it ‘looks through’ the increased sales of more expensive homes which has characterised the market since last summer.
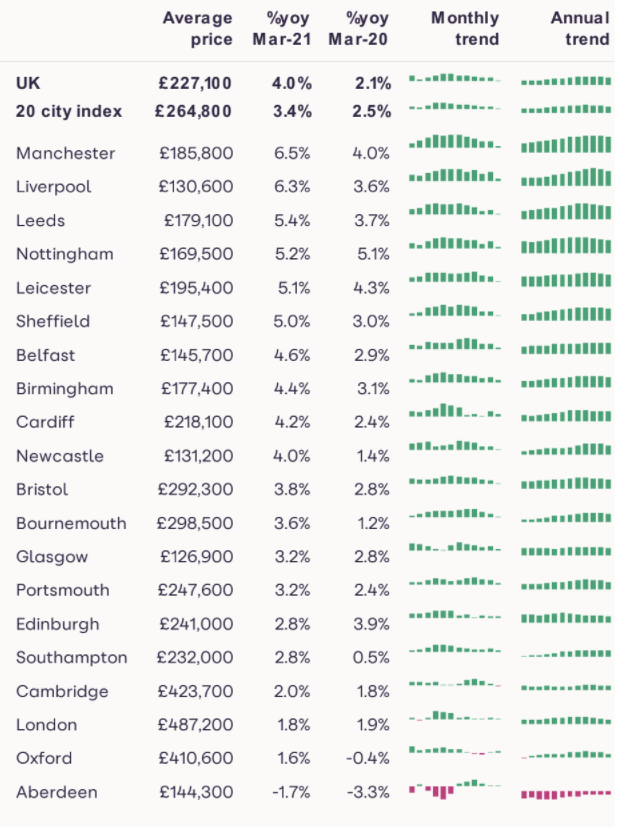
Annual price growth in the year to March continues to outperform in regions where homes are more affordable, with values growing at an annual pace of 5.9% in Wales, 5.3% in Yorkshire and the Humber and 5.2% in the North West of England.
London, which has the highest average prices for homes of any region is lagging, with 2% growth over the year.
At a city level, Manchester and Liverpool retain their spots at the top of the price charts, with 6.5% and 6.3% annual growth respectively.
At the other end of the scale for major cities, Aberdeen prices are down -1.7% on the year, although this is a more modest decline than the -3.1% seen in March last year.
Oxford and Cambridge, two of the markets with highest value housing, are registering relatively muted growth of 1.6% and 2%.
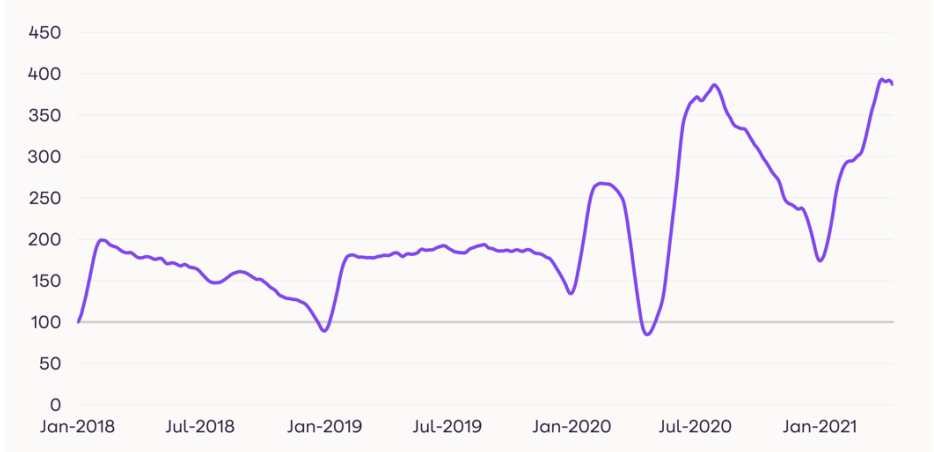
Demand for homes hits new highs
There has been strong buyer demand from the start of 2021, leading to one of the busiest sales markets in years – with the value of homes sold subject to contract in the first 15 months of the year almost double that in 2019 and 2020.
Since March, demand jumped again, to levels like those last seen in the wake of the first lock-down last summer.
The combination of children returning to school and the stamp duty holiday extension announcement in early March, as well as the return of first-time buyers and the continued ‘search for space’ among homeowners came together to create a demand boost, especially for family houses.
The cities seeing the highest levels of demand in Q1 were Birmingham, Swansea, Glasgow, Liverpool and Leicester, where average house prices are all under £200,000.
Demand peaked in the week following Easter, hitting levels more than double those seen during the same period in 2017-2019.
After the first major easing of lockdown on 12 April in England, demand levels began to fall back as households in England started to focus on catching up with friends and family, and taking advantage of leisure activities and amenities which haven’t been available since at least the turn of the year.
Buyer demand is likely to continue to ease as more parts of the country emerge from lockdown, but given the myriad factors boosting the appeal of moving listed above, buyer appetite will remain above average levels for this time of year through Q2.
Supply constrained, especially for family houses
The number of homes being listed for sale has not kept pace with buyer demand foremost of the last 12 months, eroding the total number of homes for sale in most markets, with a particular drop in the availability of family houses.
In the first half of April, the number of homes for sale was nearly 30% lower than average during the same period in 2017-2019.
The lack of supply coming to the market has been exacerbated by several factors, including the rise in activity among first-time buyers who have nothing to sell.
In addition, the lag typically observed between and rise in demand and the subsequent rise in supply was elongated at the start of the year as potential sellers were more reticent to open their homes to viewings amid high COVID-19 cases.
There was a near 30% rise in new listings after children returned to school in early/mid March and home-schooling was at an end. This took the flow of new supply to levels typical for this time of year in 2017-2019.
But it is not enough to fully replenish stocks of family houses, which remain the most in-demand type of housing.
As can be seen above, the share of family houses listed for sale has fallen to the lowest level in years, with 3-bed homes accounting for a quarter of homes available to buy, down from more than a third in 2017.
In total, houses make up 59% of listings, this year, down from 76% in 2017.
Conversely, the proportion of flats for sale has risen, a trend which chimes with second-steppers looking to move from a flat into a house amid the ongoing ‘search for space’.
When we look at the trend of constrained supply across the regions, we can see that the scale of declines is most pronounced in the North of England and Scotland, but all regions have seen at least a 20% fall in the availability of family houses for sale.
Market outlook
The tight market for family homes will limit further growth in sales volumes in the short-term. However supply will start to build as homeowners become increasingly comfortable opening their homes to viewings.
The scale of buyer demand will also moderate from the peaks seen after Easter as lockdowns end across the UK and households are able to return to some level of pre-pandemic ‘normality’, enjoying amenities with family and friends.
However, the supply/demand imbalance will remain. The ‘search for space’ among homeowners has further to run, especially as some office-based businesses are now confirming how their working practices will change in the longer-term.
More flexible working arrangements open up new opportunities for homeowners to move to a different location.
At the same time, the roll-out of the 95% mortgage guarantee will mean more demand from first-time buyers.
UK annual house price growth was at 2.1% at the start of the first lockdown, and is now at 4% after peaking at 4.5% in January.
Prices will be continue to underpinned by the ongoing demand/supply imbalance, with the strongest growth in the more affordable markets in the North and Midlands.
The scale of price growth will slow in the coming months however, especially as we move towards Q3 when the stamp duty holiday extension comes to an end and government support for the economy starts to be pared back.
UK House Price Index – March 2021
By Richard DonnellRelated articles
Sellers need to remain realistic on where they set the asking price if they are to take advantage of improving market conditions to secure a sale and move home in 2024.
After a busy start to 2022, the market will start to move back to pre-pandemic conditions, allowing supply pipelines to rebuild. However, the demand/supply imbalance will not fully unwind, and this will be one factor supporting price growth of 3% next year.
House price growth is starting to ease, although the path over the next year will not be linear. We expect UK average price growth to end 2022 firmly in positive territory at 3%.
The impact of the pandemic has further to run. The current momentum in the market will largely offset growing headwinds over 2022 with average UK house prices increasing by 3% and 1.2m sales.

Subscribe to receive email updates.
HometrackGlobal:
Linked In: