Confirming payment details

Payment processing
Login or Sign up
Forgot password
Enter your email address and we will send you a password reset link or need more help?
UK House Price Index – June 2021
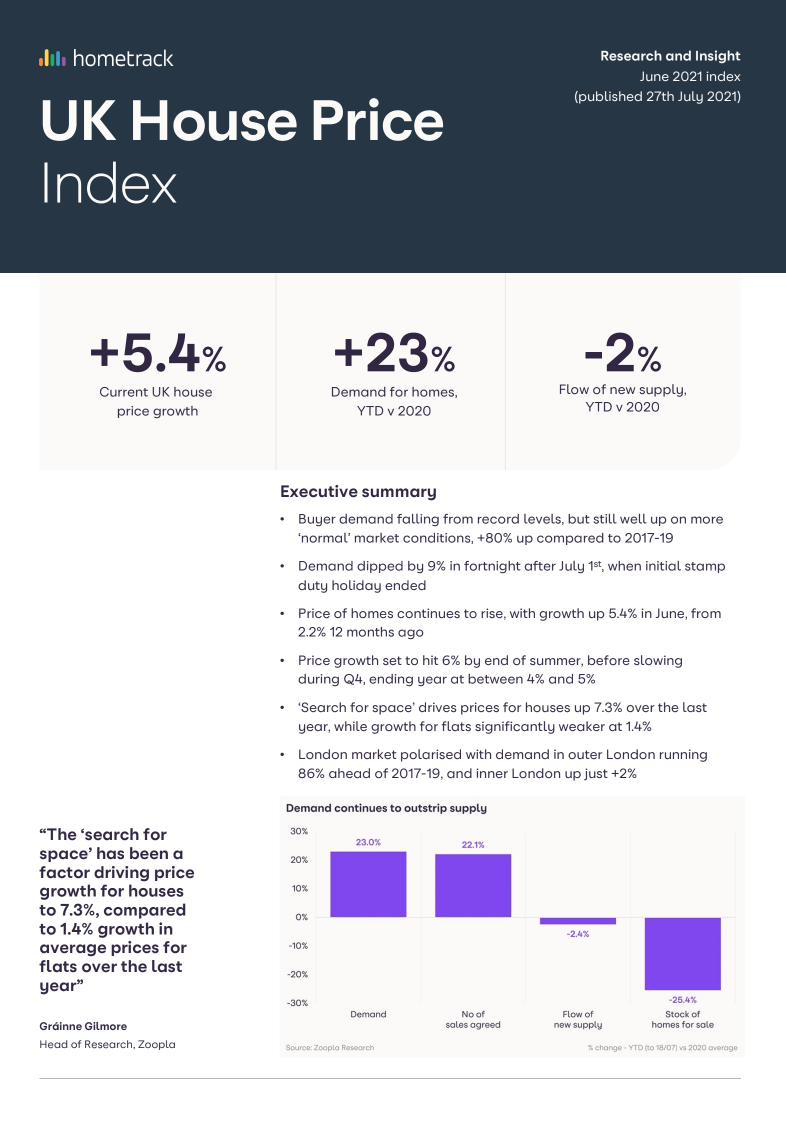
By Richard Donnell on 27 July 2021- Buyer demand falling from record levels, but still well up on more ‘normal’ market conditions, +80% up compared to 2017-19
- Demand dipped by 9% in fortnight after July 1st, when initial stamp duty holiday ended
- Price of homes continues to rise, with growth up 5.4% in June, from 2.2% 12 months ago
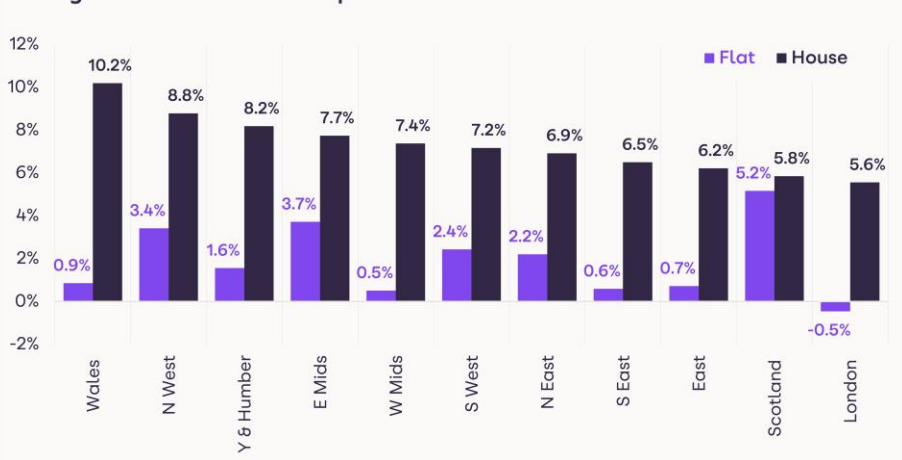
The ‘search for space’ has been a factor driving price growth for houses to 7.3%, compared to 1.4% growth in average prices for flats over the last year
Annual UK house price inflation at +5.4%
Average house prices rose by 1.3% in Q2, taking the annual rate of growth to 5.4%, up from 2.2% registered in June last year.
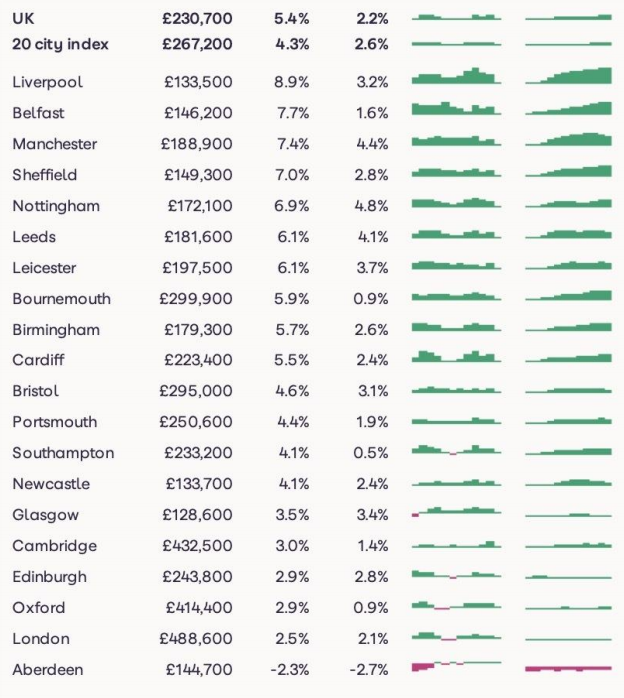
Prices are being pushed upwards by particularly strong growth in Wales and the North West of England, which, at 8.4% and 7.3% respectively, are the highest rates of house price growth in these regions for 16 years.
There is also strong price growth in Northern Ireland (8.6%). On a city level, Rochdale, Bolton and Hastings are all registering growth of more than 9%, while Liverpool (8.9%) Belfast (7.7%) & Manchester (7.4%), are recording the highest levels of house price growth among the UK’s larger cities.
At the other end of the scale, prices continue to fall in Aberdeen (-2.3%) where the market is closely aligned with the oil industry. Average values are also falling on an annual basis in several local authorities in central London.
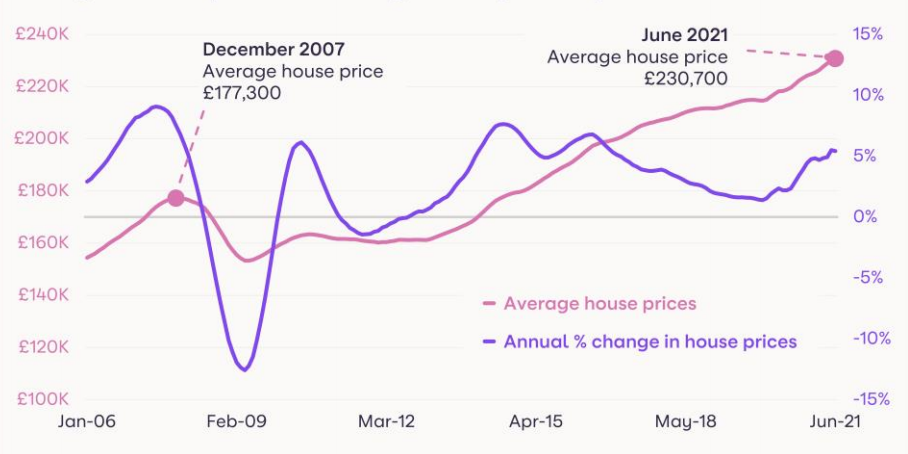
Overall, the average value of a home in the UK reached £230,700 in June, marking a 30% rise since the previous market peak in 2007.
We expect the headline index figure will continue to rise in the coming months peaking at 6%, as the more competitive market conditions in Q2 filter through, especially in the more affordable markets in the Midlands and the North.
Price growth will start to ease towards the end of the year as the impact of the extended stamp duty unwinds, and the government support for the economy starts to be withdrawn.
However, we forecast that price growth will still be firmly in positive territory, between 4% and 5%, in December.
Robust demand
Prices are still being supported by strong levels of demand in the market.
While buyer demand has eased since the peak in April, when levels were unsustainably high, they are still running 80% higher at this time of year compared to more ‘normal’ market conditions between 2017 and 2019.
As the economy opens up, it is to be expected that demand will ease again, especially as the holiday season starts. But there will still be active buyers driven by the ‘search for space’, households making lifestyle changes and the increased activity among first-time buyers, and these trends have further to run through H2.
Low mortgage rates are making a home move more affordable, with Nationwide launching the first sub-1% five-year mortgage deal this month for those who only need to borrow up to 60% of the value of their home.
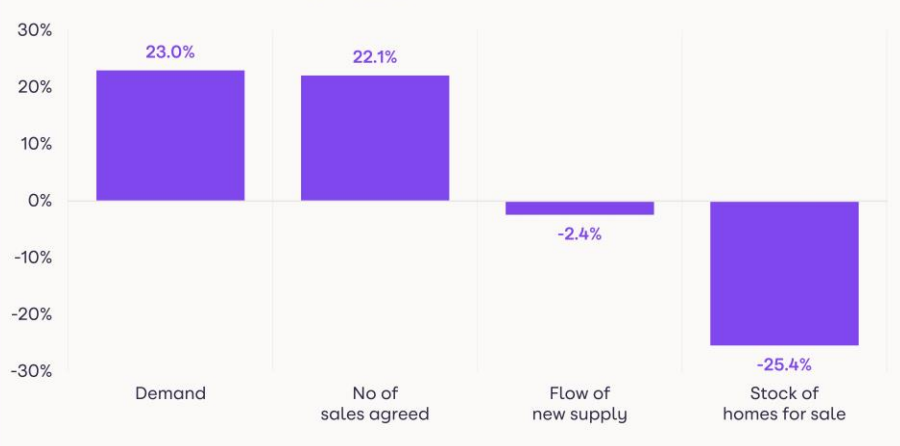
At the same time, the supply of homes is not keeping pace. The flow of new supply has started to return to more usual levels for this time of year, but it is not enough to replenish stock levels, which are running 25% below average 2020 levels.
Supply has been constrained by the rise in activity among first-time buyers (lending to first-time buyers is up 25% compared to 2020), who have nothing to sell, but also by the sheer levels of activity in the market which has eroded the total number of homes for sale.
This, in turn, may be hampering some potential activity in the market. Even so, the number of sales agreed are still running 22% ahead of 2020 average levels, and will remain higher than previous years as homeowners continue to take advantage of the extended stamp duty holiday - with savings of up to £2,500 on offer until the end of September.
We forecast there will be around 1.5 million completed transactions this year, up from 1 million last year, and the highest level since 2007.
Search for space
This phrase has moved into common usage since the first lockdown, as hundreds of thousands of households active in the market over the last year have factored an increased need for indoor and outdoor space into their home moving decisions.
This trend is also clear in the data, with demand for houses now twice that registered during 2017-19. In contrast, demand for flats has not kept pace, up +34%.
As a result of strong demand, average prices for houses, from terraces to detached, are up 7.3% in the year to the end of June, up from 1.9% in the previous 12 months.
In contrast, price growth for flats is lagging at 1.4%, which is unchanged compared to the previous 12 months. Pricing expectations from vendors will need to factor in these trends.
Polarised London
Annual price growth in London has been trailing the rest of the UK since late last year, and this month is no exception, with 2.3% growth, compared to an average of 5.4% across the country.
However, the outer London boroughs are registering higher price growth. This is underpinned by stronger domestic demand, with the latest data showing purchaser demand in outer London is still running 86% higher than the average levels for this time of year registered between 2017 and 2019.
This will, at least in part, be due to housing stock in these areas, with larger volumes of houses and properties with outside space available to buy.
In contrast, in inner London, demand levels are running only 2% above the average compared to more ‘normal markets’. This is also reflected in the pricing of properties, with London flats, predominantly clustered towards the centre, falling by 0.5% in the year to June, compared to houses, which have registered growth of 5.6%.
As a global city, London’s housing market has been affected by a lack of international travel, especially in the central boroughs of Westminster, Kensington & Chelsea and Hammersmith and Fulham.
Yet, in the rental market, which is the quickest market to react to the economic and societal landscape, demand in these central London zones has bounced back since the economy has started to open up.
If the economy can stay open without any setbacks due to COVID, domestic demand in the sales market will also start to rise in central London due to the allure of proximity to offices and amenities.
There has already been positive momentum on prices in these boroughs on a quarterly basis, with prices rising 0.4% in Q2.
Any move to relax the restrictions on global travel will also result in a firmer pick-up in demand which will also reverse the downward trend in pricing - however this is all dependent on international COVID cases, and will not materialise for some time yet.
Outlook
Demand is moderating from record high levels earlier in the year, but remains significantly up from typical levels, signalling that above average activity levels will continue in the coming months.
Demand for houses outstripping demand for flats. To a certain extent this trend will have been augmented by the stamp duty holiday, with bigger savings on offer for larger properties - typically houses.
But underneath this, there is a continued drumbeat of demand for more space, both inside and outside, again funnelling demand towards houses, resulting in a disparity in price growth.
Vendors will need to consider this when it comes to pricing expectations. London has a two-speed market at present, with domestic demand driving price growth in the outer boroughs, while the lack of international business and leisure travel is affecting demand in the more global real estate markets towards the centre of the city.
As COVID progresses at different rates across the world, unrestricted travel may not resume for some time yet, but when it does, international demand will start to pick up once more.
Across the UK, buyer demand coupled with constrained supply signal that price growth will continue to rise in the coming months, peaking at around 6%, before easing to between 4%-5% by the end of 2021
UK House Price Index – June 2021
By Richard DonnellRelated articles
Sellers need to remain realistic on where they set the asking price if they are to take advantage of improving market conditions to secure a sale and move home in 2024.
After a busy start to 2022, the market will start to move back to pre-pandemic conditions, allowing supply pipelines to rebuild. However, the demand/supply imbalance will not fully unwind, and this will be one factor supporting price growth of 3% next year.
House price growth is starting to ease, although the path over the next year will not be linear. We expect UK average price growth to end 2022 firmly in positive territory at 3%.
The impact of the pandemic has further to run. The current momentum in the market will largely offset growing headwinds over 2022 with average UK house prices increasing by 3% and 1.2m sales.

Subscribe to receive email updates.
HometrackGlobal:
Linked In: