Confirming payment details

Payment processing
Login or Sign up
Forgot password
Enter your email address and we will send you a password reset link or need more help?
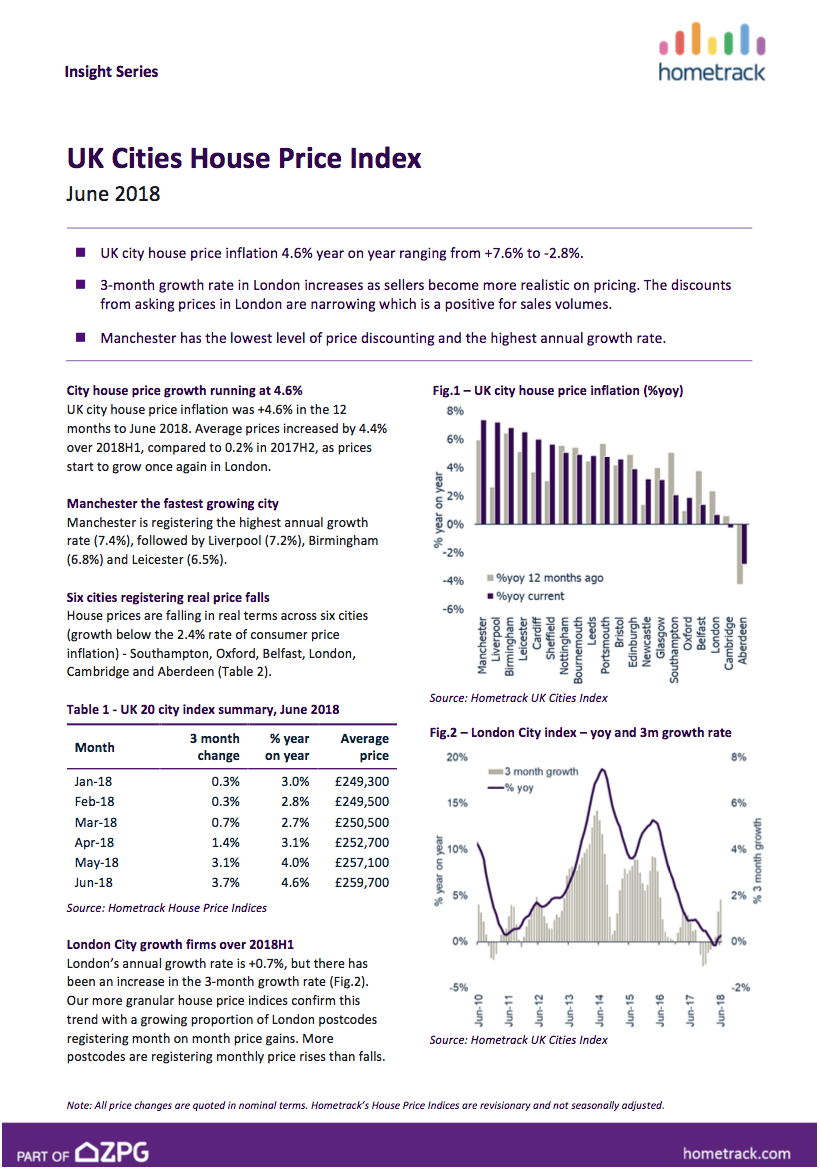
UK Cities House Price Index - June 2018
On 25 July, 2018- UK city house price inflation 4.6% year on year ranging from +7.6% to -2.8%.
- 3-month growth rate in London increases as sellers become more realistic on pricing. The discounts from asking prices in London are narrowing which is a positive for sales volumes.
- Manchester has the lowest level of price discounting and the highest annual growth rate.
City growth ranges from +7.6% in Manchester to -2.8% in Aberdeen. 3-month growth rate in London is increasing as sellers become more realistic on pricing, while discounts from asking prices in London are narrowing for first time in 2 years. Manchester has the lowest level of price discounting.
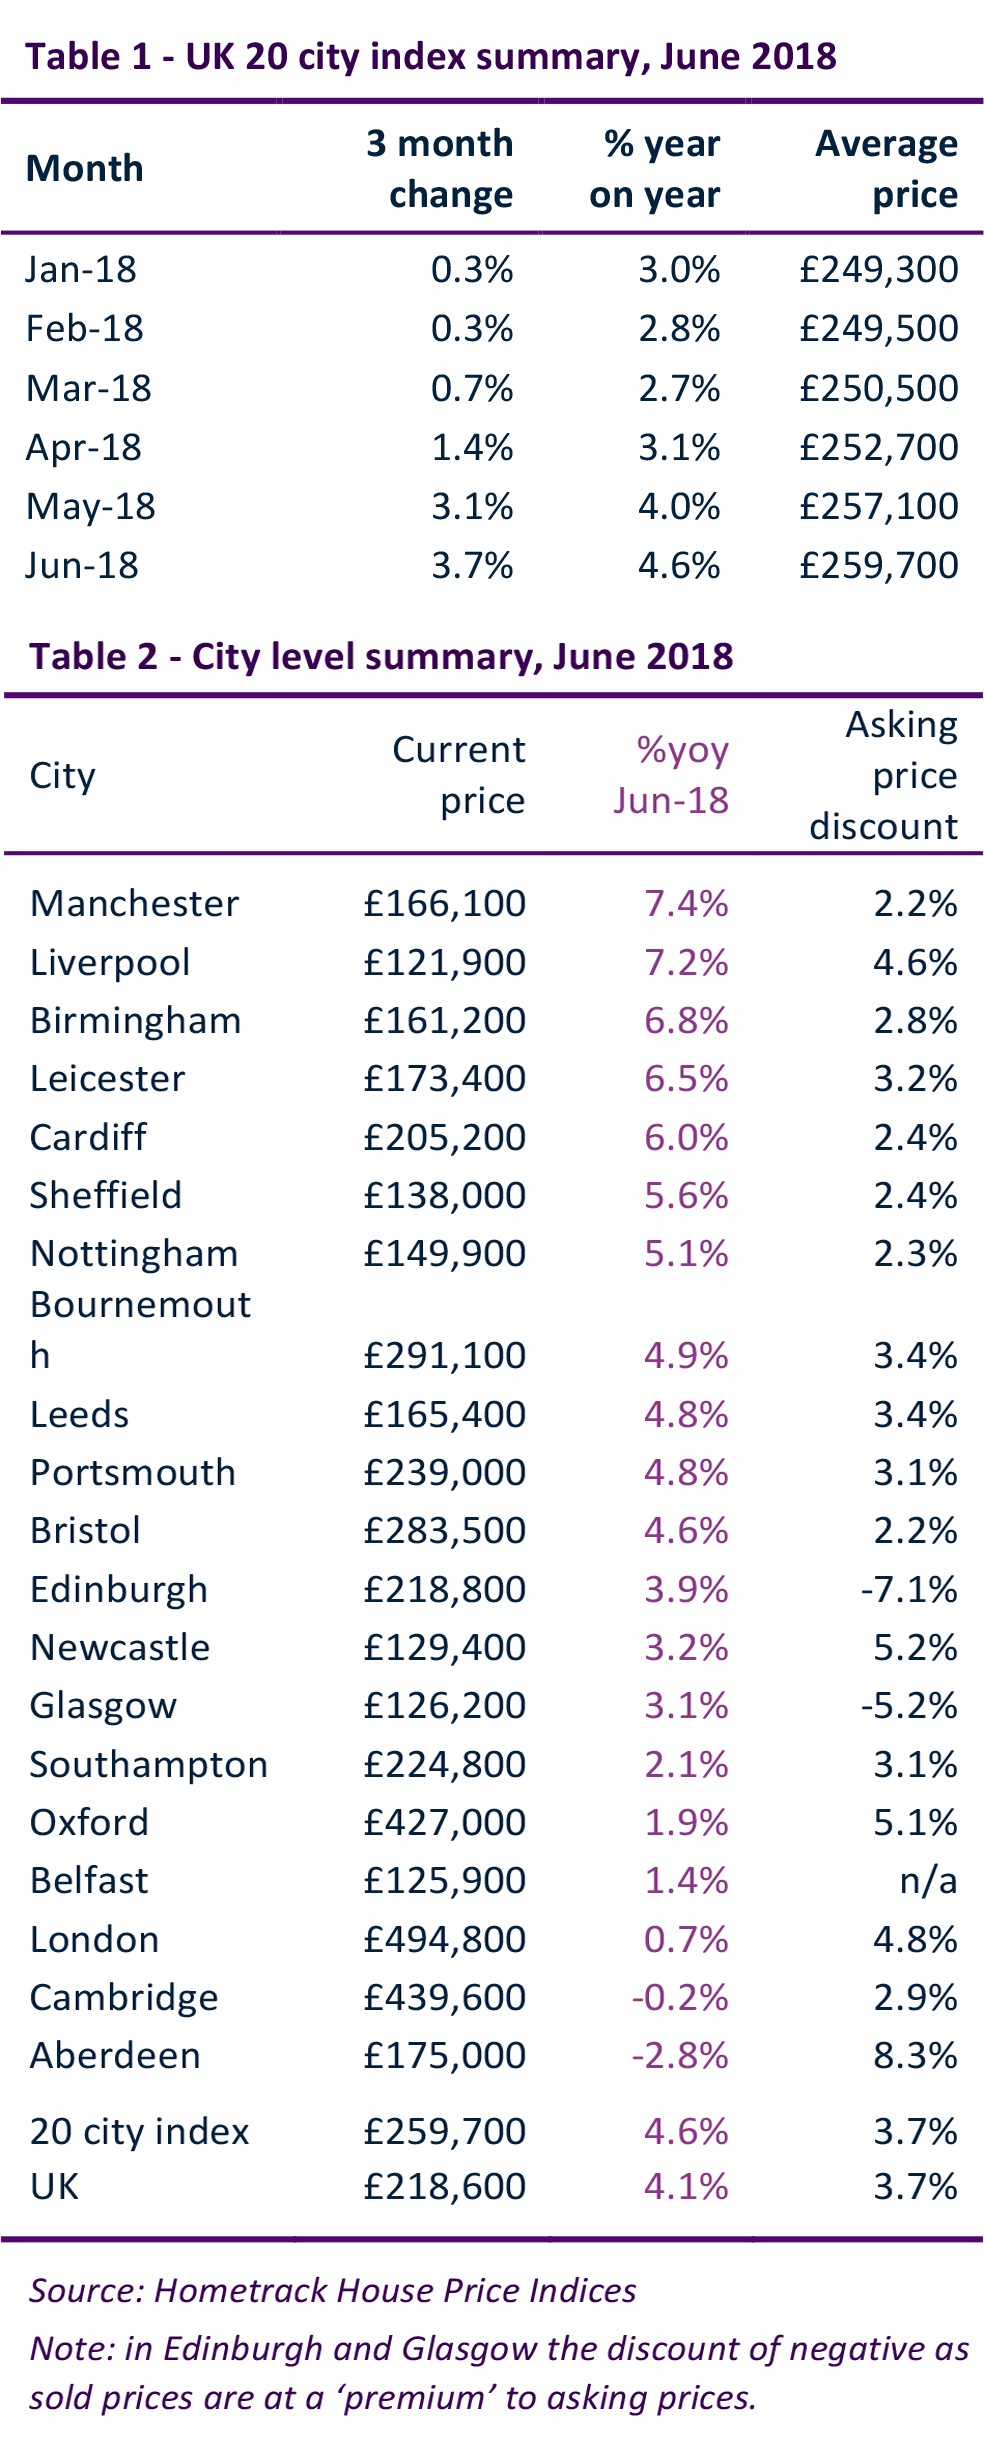
City house price growth running at 4.6%
UK city house price inflation was +4.6% in the 12 months to June 2018. Average prices increased by 4.4% over 2018H1, compared to 0.2% in 2017H2, as prices start to grow once again in London.
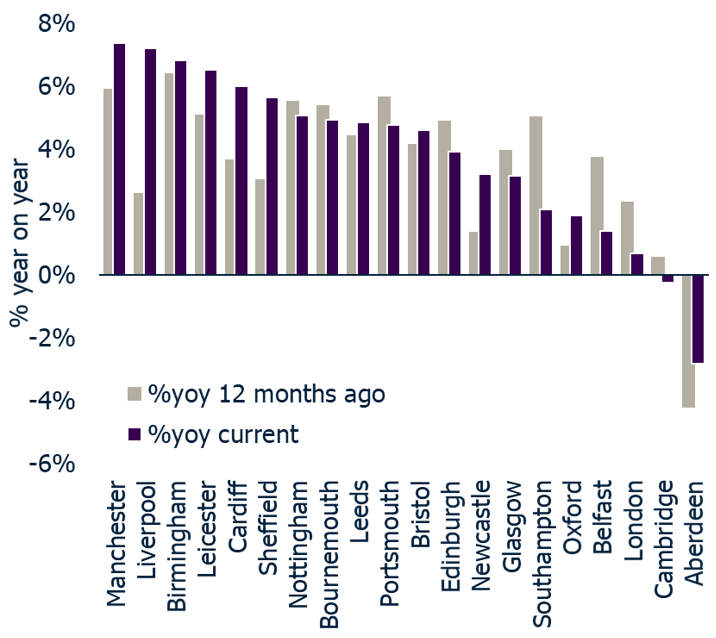
Manchester the fastest growing city
Manchester is registering the highest annual growth rate (7.4%), followed by Liverpool (7.2%), Birmingham (6.8%) and Leicester (6.5%).
Six cities registering real price falls
House prices are falling in real terms across six cities (growth below the 2.4% rate of consumer price inflation) - Southampton, Oxford, Belfast, London, Cambridge and Aberdeen (Table 2).
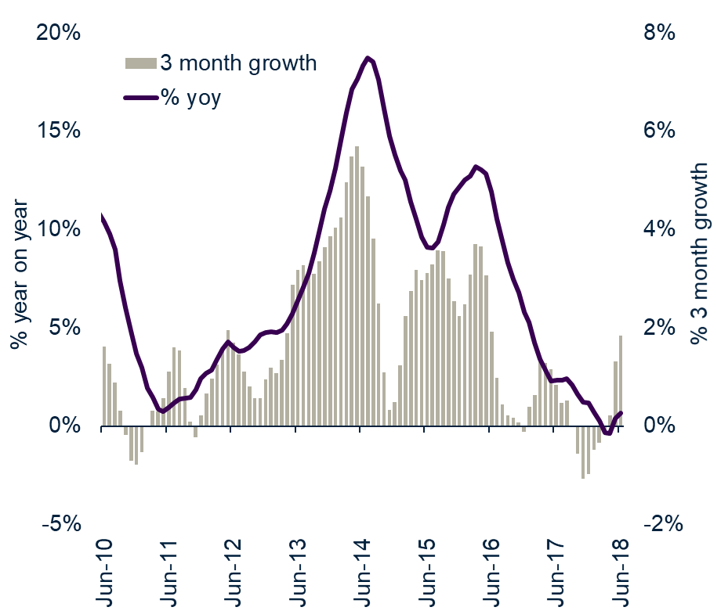
London City growth firms over 2018H1
London’s annual growth rate is +0.7%, but there has been an increase in the 3-month growth rate (Fig.2). Our more granular house price indices confirm this trend with a growing proportion of London postcodes registering month on month price gains. More postcodes are registering monthly price rises than falls.
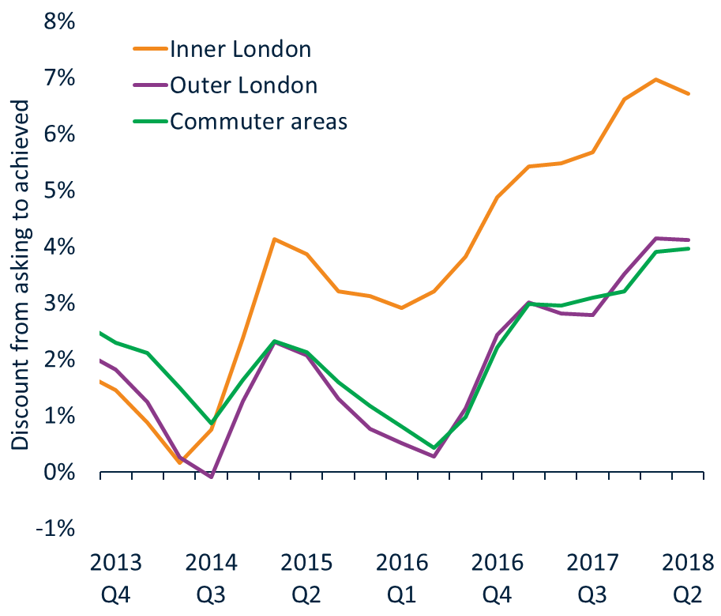
Greater realism after 2-year re-pricing
The current stabilisation in London house price growth reflects greater realism on the part of sellers in the wake of a two-year re-pricing process. Since 2016 the discount from asking prices to sales prices has widened, reaching a high of 7% in inner London at the end of 2017 (Fig.3).
Discount from asking price narrows in London
Over the first half of 2018 the level of discounting to achieve a sale has started to narrow in inner London to 6.7%. Discounts have stabilised in outer London and the adjacent commuter areas. This is consistent with less downward pressure on prices.
Fall in London sales volumes at and end
While we expect the rate of price inflation to remain weak across London, greater realism on the part of sellers is positive news for transaction volumes which have fallen 20% since 2014.
Discount from asking prices varies across cities
The discount from asking to sale prices provides important insight into the relative strength of local housing markets. For example, Liverpool has the second fastest rate of growth as prices rise quickly off a low base. The level of discounting in the city has narrowed over the last two years but remains above average at 4.6%. Fig.4 shows the discount from asking prices across selected cities while Table 2 contains the latest data for each city.
Lowest discounts from asking price in Manchester
Manchester has the lowest level of discounting (2.2%) across all the cities in England and Wales. This remains on a downward trend and it is no surprise the city is currently registering the fastest growth in prices.
Growth rate in Birmingham moderates
House price inflation in Birmingham has moderated over the last year and the gap between asking and achieved prices has started to plateau, standing at 2.8%. We expect a continued moderation in the rate of house price inflation over the next 12 months.
Level of discounting grows in southern England
Cities across south eastern England have registered slower price growth as affordability pressures increase. Southampton, for example, is registering annual house price growth of just 2.1% while the level of discounting has increased from 2% to almost 4% since 2017Q3.
Prospects for 2018H2
We expect current trends to continue into the second half of 2018 as housing market forces continue to play out against the backdrop of rising employment and low mortgage rates. The main risks on the horizon are 1) the timing and scale of any increase in mortgage rates and 2) how the BREXIT negotiations unfold in the coming months and in the run up to March 2019.
UK Cities House Price Index - June 2018
Related articles
Sellers need to remain realistic on where they set the asking price if they are to take advantage of improving market conditions to secure a sale and move home in 2024.
After a busy start to 2022, the market will start to move back to pre-pandemic conditions, allowing supply pipelines to rebuild. However, the demand/supply imbalance will not fully unwind, and this will be one factor supporting price growth of 3% next year.
House price growth is starting to ease, although the path over the next year will not be linear. We expect UK average price growth to end 2022 firmly in positive territory at 3%.
The impact of the pandemic has further to run. The current momentum in the market will largely offset growing headwinds over 2022 with average UK house prices increasing by 3% and 1.2m sales.

Subscribe to receive email updates.
HometrackGlobal:
Linked In: