Confirming payment details

Payment processing
Login or Sign up
Forgot password
Enter your email address and we will send you a password reset link or need more help?
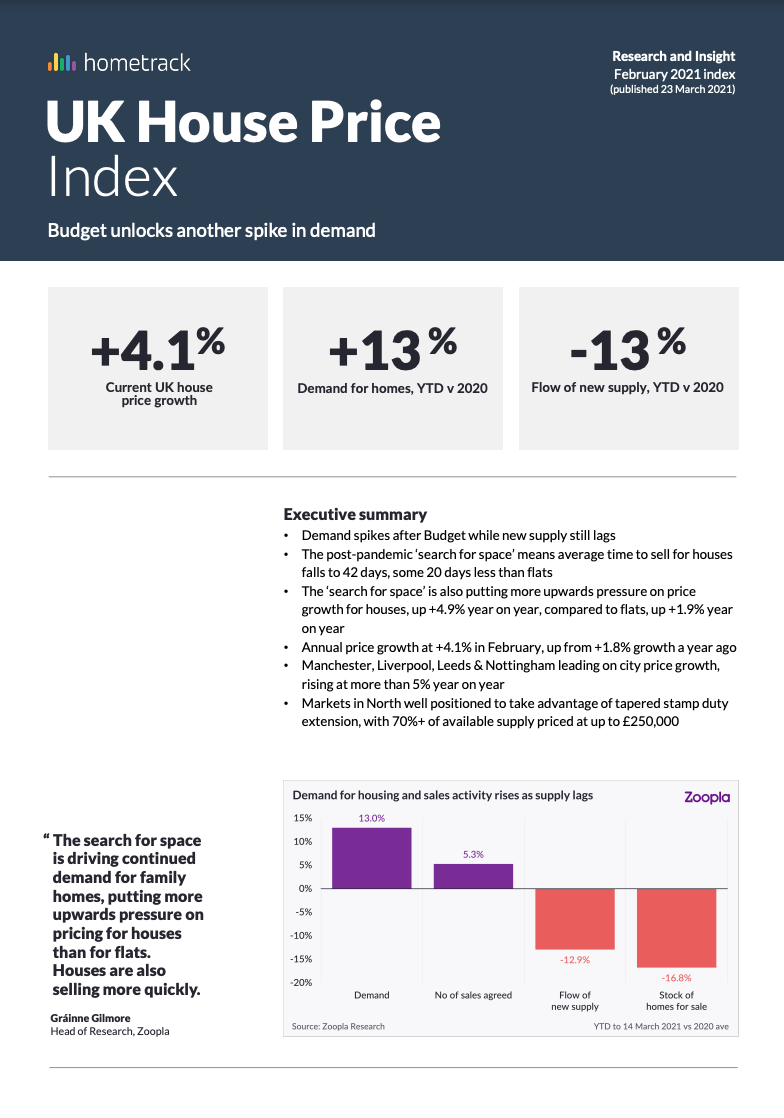
UK House Price Index – February 2021
By Richard Donnell on 23 March 2021- Demand spikes after Budget while new supply still lags
- The post-pandemic ‘search for space’ means average time to sell for houses falls to 42 days, some 20 days less than flats
- The ‘search for space’ is also putting more upwards pressure on price growth for houses, up +4.9% year on year, compared to flats, up +1.9% year on year
The recent Budget stimulated an +80% spike in buyer demand for property compared to the four year average
Annual UK house price inflation +4.1%
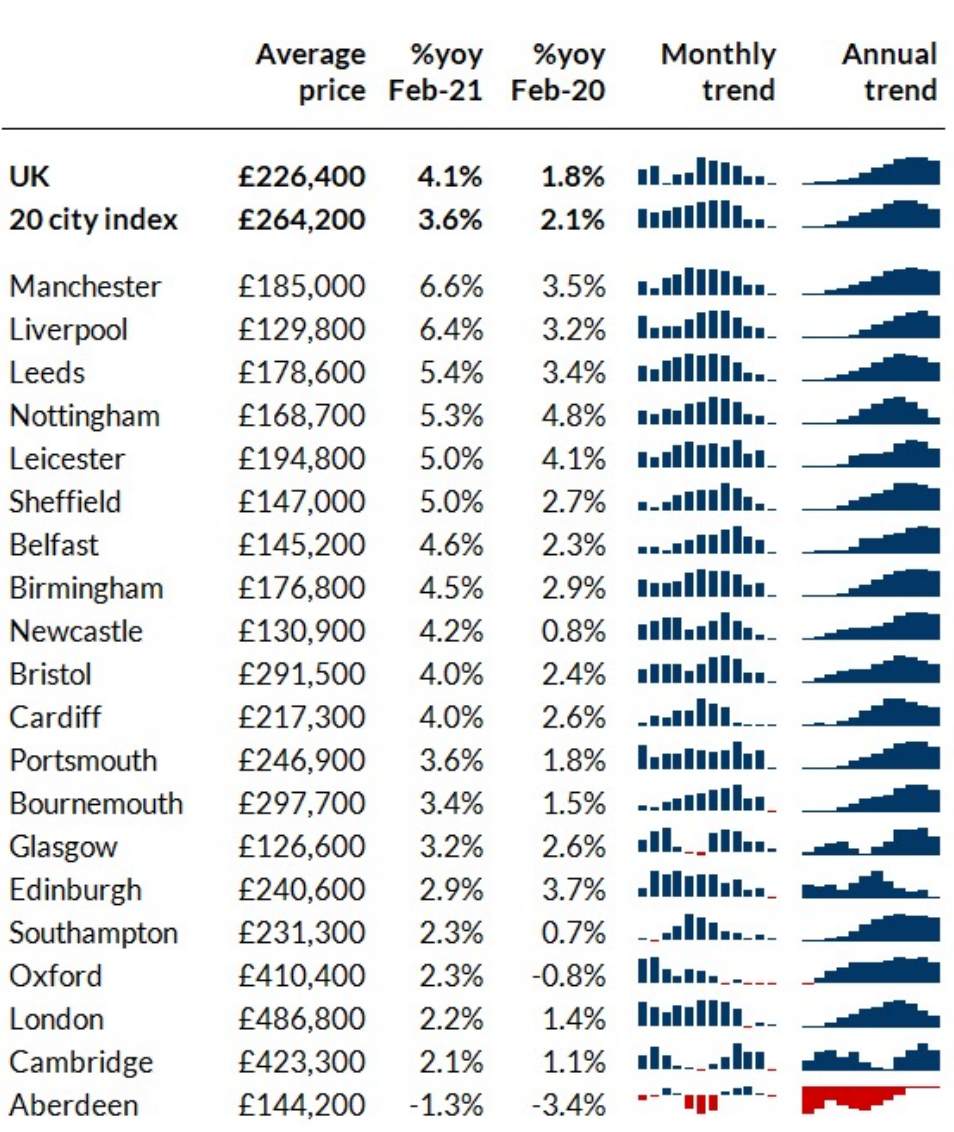
House prices climbed by 0.5% in between December and February, taking the annual rate of growth to 4.1%. This is down from 4.4% growth in January, but marks the fourth consecutive month price growth has been above 4%, matching levels last seen in summer 2017.
Price growth ranges from 5.7% in Wales and 5.3% in the North West of England, to London, trailing with 2.3% growth.
Meanwhile Liverpool and Manchester continue to show the strongest levels of annual house price growth at a city level, at 6.6% and 6.4% respectively, while prices in Aberdeen are down 1.3% on the year.
Post-budget spike in demand for housing
The Chancellor’s announcement of a stamp duty holiday extension and 95% mortgage guarantees created a 24% spike in buyer demand in England and Northern Ireland the days following the Budget, as more first-time buyers and movers entered the market.
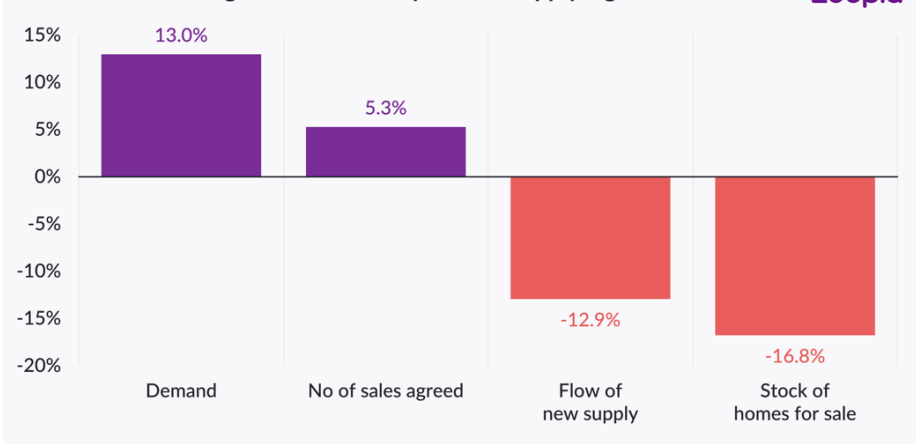
Average buyer demand levels since the start of this year are running 13% higher than average levels across the whole of 2020. The largest post-budget bounce in demand was for three-bed houses - this type of home is attracting the largest levels of demand across the country.
However, there was a noticeable spike in demand for one and two-bedroom flats in London and the South East after the Chancellor’s announcements, signalling increased buying intent among first-time buyers and those looking to take advantage of the tapered stamp duty holiday.
While there was a slight post-budget rise in supply, overall supply levels remain deeply constrained, with total supply this year down 13% vs the 2020 average.
As lockdowns ease and vaccinations continue to be rolled out, we expect more pent-up supply to come back to the market as vendors feel more comfortable opening their homes for viewing, albeit with the usual seasonal Easter dip.
Increasing activity levels among first-time buyers, especially as they take advantage of more 95% mortgages from April 1st, will keep pressure on the demand/supply imbalance however, as these buyers have no properties to sell.
The ‘search for space’ pushes house prices ahead
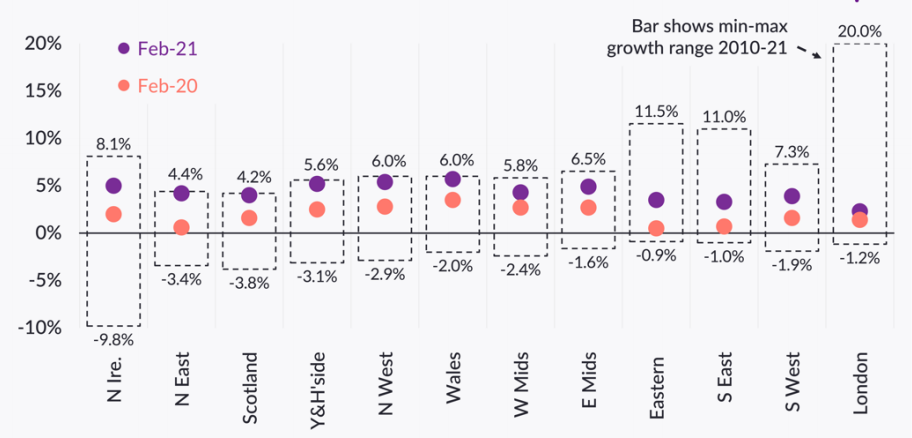
Demand for homes is strongest in the most affordable parts of the housing market, boosting price growth. The annual rate of change in house prices are near decade-high levels in the Midlands and the North.
In contrast, the level of price growth in the South of England is lagging slightly, and relatively muted compared to longer-term trends, reflecting affordability factors.
Continued demand for larger family homes as buyers look for more inside and outside space in the wake of multiple lockdowns is putting upward pressure on the value of houses, especially as supply remains constrained.
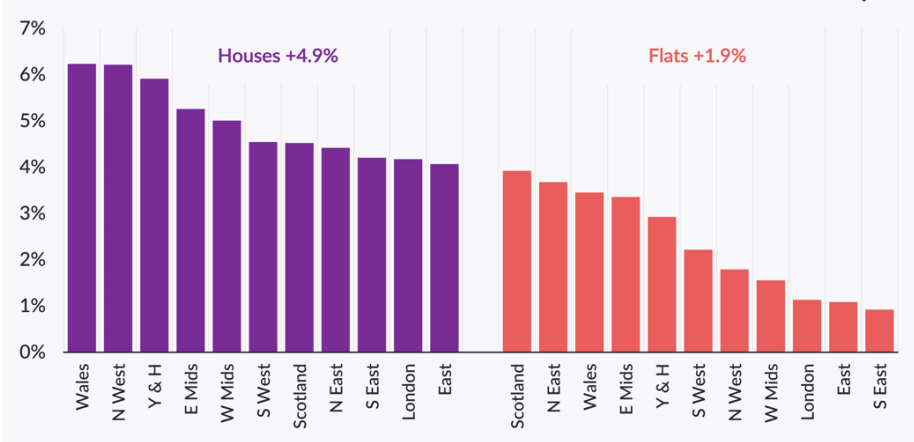
Across the UK, the average price for a house has risen by +4.9% over the last 12 months, compared to a +1.9% increase for flats. \
Prices have risen most strongly in Wales and the North West, where the average value of a house is up 6.2% on the year. The price growth for flats is notably smaller in comparison, at 3.5% in Wales and 1.8% in the North West.
Markets moving faster as time to sell falls
Sales activity in the market has risen, but is constrained by the lack of supply, the number of sales agreed in the year to date are up 5.3% compared to 2020.
But the sheer demand in the market has had a dramatic effect on how quickly sales are being agreed. The average time to sell a property has fallen by nearly a week across the UK excluding London.
This means it is taking around 44 days from listing a property to agreeing a sale, down from 50 days last year. Houses are selling faster than flats, taking an average of 42 days to sell across the UK, compared to 62 days for flats.
London is the only region where properties are taking longer to sell now than they were last year. This is partly a reflection of how strongly the London market bounced back in early 2020 after the General Election in 2019, but also signals how Covid-19 restrictions have affected the London residential market, especially in central areas.
London is a key global city, but domestic and international travel restrictions for leisure and business have limited movement over the last 12 months, with a resulting impact on the residential market, especially in central zones.
The ‘search for space’ has augmented this trend, with activity rising in the areas in outer zones and areas surrounding the capital which have a larger proportion of houses with gardens.
There will be an unwinding of this trend as global travel starts again. As we move into Q3, we are likely to see the central London market shrug off factors such as the ending of furlough and the stamp duty holiday - which may affect other parts of the UK housing market - as global demand returns.
Outlook
The Chancellor’s announcement of a stamp duty holiday tapered extension means that hundreds of thousands more buyers will benefit from some level of stamp duty reprieve.
Allowing four months for completions after agreeing sale means that most buyers now will be looking to benefit from the stamp duty holiday on the first £250,000 of their purchase, by completing by the end of September, rather than the first £500,000 which means a completion by the end of June.
Buyers in the North are in pole position to benefit the tapered extension, with more than two-thirds of homes currently listed for sale at under £250,000 – attracting no stamp duty at all.
As such, we expect continued upwards pressure on pricing in the North and Midlands as demand, which we had expected to be sustained even if the stamp duty holiday ended, is now further encouraged by the continued savings on offer.
The data signals that the ‘reassessment of home’ among existing homeowners is set to continue, resulting in a search for space - inside or out, or looking to live in a different location.
As lockdowns start to ease, and COVID-19 cases recede, we are set to see more supply come to the market as sellers feel more comfortable inviting potential buyers into their home. This in turn will lead to more activity in the market.
This could put increased pressure on the sales completion process, something buyers will bear in mind as we move through the summer.
All of these factors will support activity levels and headline house price growth up to the end of Q2 2021. While the prospects for the housing market over the year ahead have improved on the back of Budget, the pathway out of the lockdown, and the route to a full reopening of the economy and unwinding of support measures, is unlikely to be simple or smooth.
We still expect house price growth to moderate later in the year, but overall transactions let set to get an additional boost from the stamp duty measures.
UK House Price Index – February 2021
By Richard DonnellRelated articles
Sellers need to remain realistic on where they set the asking price if they are to take advantage of improving market conditions to secure a sale and move home in 2024.
After a busy start to 2022, the market will start to move back to pre-pandemic conditions, allowing supply pipelines to rebuild. However, the demand/supply imbalance will not fully unwind, and this will be one factor supporting price growth of 3% next year.
House price growth is starting to ease, although the path over the next year will not be linear. We expect UK average price growth to end 2022 firmly in positive territory at 3%.
The impact of the pandemic has further to run. The current momentum in the market will largely offset growing headwinds over 2022 with average UK house prices increasing by 3% and 1.2m sales.

Subscribe to receive email updates.
HometrackGlobal:
Linked In: