Confirming payment details

Payment processing
Login or Sign up
Forgot password
Enter your email address and we will send you a password reset link or need more help?
UK House Price Index – August 2020
By Richard Donnell on 28 September 2020- • Ongoing supply/demand imbalance supports headline growth rate
- • Gap opening up in relative strength of demand between existing homeowners and first-time buyers
- FTBs have been a driving force for sales over the last decade. They remain a key buyer group but increased movement by home-owners means a modest decline in the share of sales by FTBs into 2021
First time buyers have been the engine for housing market over the last decade but greater movement amongst existing home owners means a shift in the mix of moving households in 2021
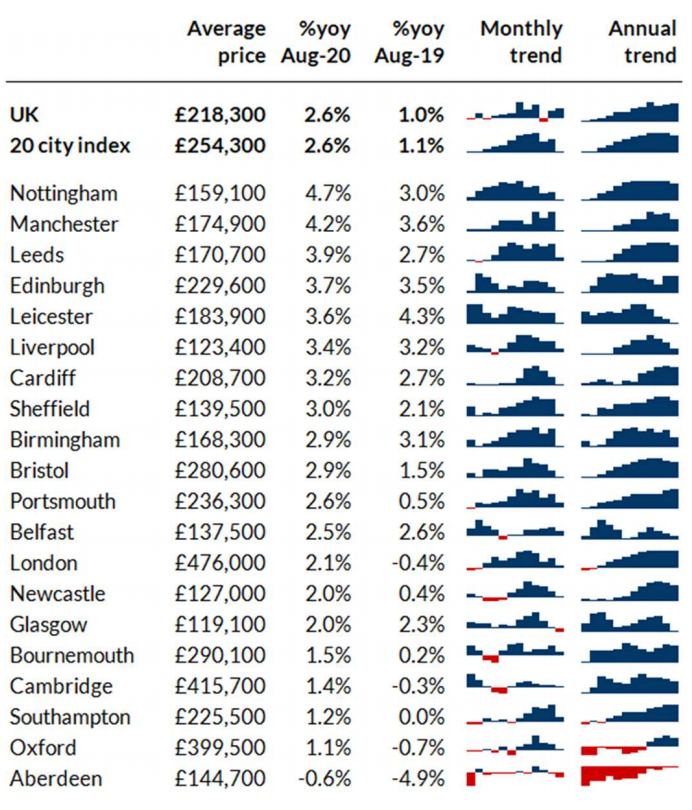
Annual UK house price inflation +2.6%
House prices continue to increase as demand runs ahead of supply across the UK housing market. The annual UK growth rate is +2.6%, up from +1% a year ago.
At a region and country level house price growth ranges from +1.7% in the North East to +3.3% in the North West, Yorkshire and the Humber and Wales. At a city level Nottingham and Manchester are recording annual price inflation of over 4%.
Supply/demand imbalance supports upward pressure on prices
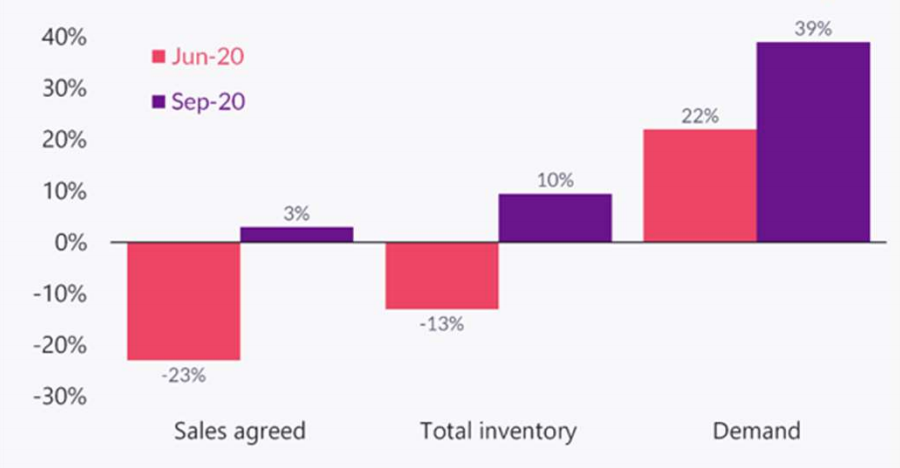
The impetus for price rises shows no signs of slowing as new buyers continue to enter the market. Since the start of the year, demand for housing is 39% higher than at this stage last year.
More buyers also bring more supply to the market and available sales inventory is 10% higher than a year ago. Greater supply increases choice for buyers and will keep the rate of house price inflation in check.
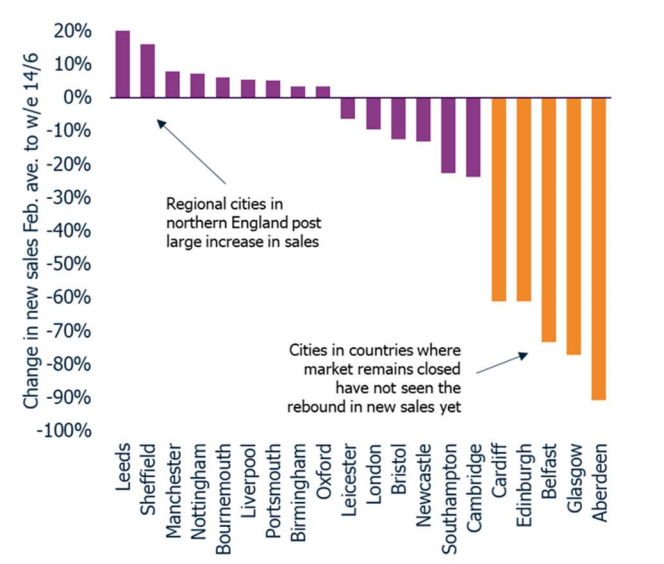
The strength of the recovery so far is highlighted in new sales agreed which over the last 9 months are 3% higher than over the same period last year - and this with a 50-90 day closure of the housing market.
The 3-4 month lag between sales agreed and legal completion means we will not make up all the ground lost during the market closure this calendar year.
Completed housing sales are set to be 15% lower than in 2019. A continuation of demand and sales over the autumn, albeit at a slower pace, will support sales volumes, and estate agency revenues, into the first quarter of 2021.
Further COVID-19 restrictions to support demand in near term
We have previously highlighted how the strength of the housing market is being driven by a once in a lifetime re-evaluation of housing in response to COVID-19 and the lockdown.
Households are prioritising space and location as well as factoring in a shift in working patterns. Less time spent meeting friends and family in public locations will re-enforce the importance of the home.
We believe that a second spike in new cases and a tightening of restrictions announced by the Government will only serve to support this trend, primarily for those households in more secure financial positions.
However, the housing market is not immune to any prolonged weakening in the economy and the impact of less Government support.
Demand gap between homeowners and first-time buyers
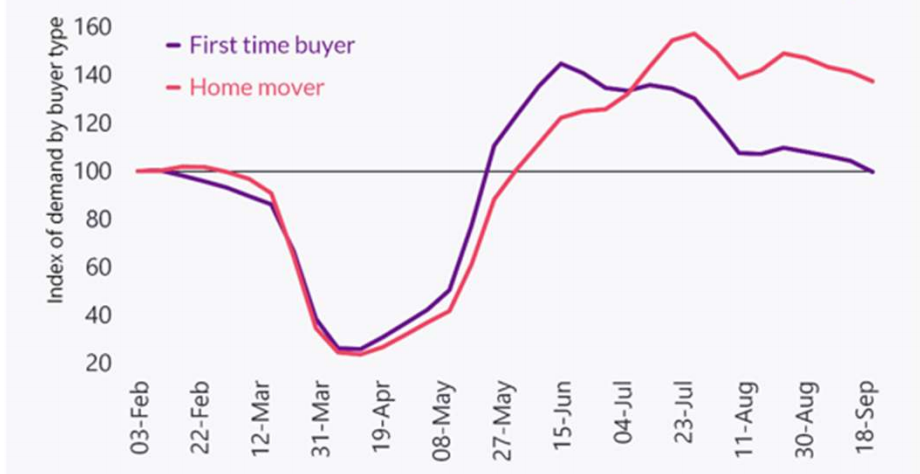
The strength of demand driving housing sales is not uniform across buyer groups. Tracking demand by purchaser type on a rolling weekly basis since February 2020 shows a gap opening between existing home-owners and FTBs.
FTB demand spiked immediately after the lockdown ended but has lost momentum as a result of growing economic uncertainty and reduced availability of higher loan to value mortgages.
Demand from FTBs remains well above 2019 levels but has fallen back in line with pre COVID-19 levels. We expect it to decline slowly over the rest of 2020.
In contrast, demand from existing home-owners was slower to respond immediately after the lockdown but remains elevated, 37% higher than pre-COVID-19 levels and 53% above this time last year.
There is pent-up demand in this group that we believe could support the housing market into 2021. This divergence in demand is clear at a region and country level with the relative strength of FTBs weaker than that from existing home-owners when compared to pre-COVID-19 levels.
Variable impact on first-time buyer demand
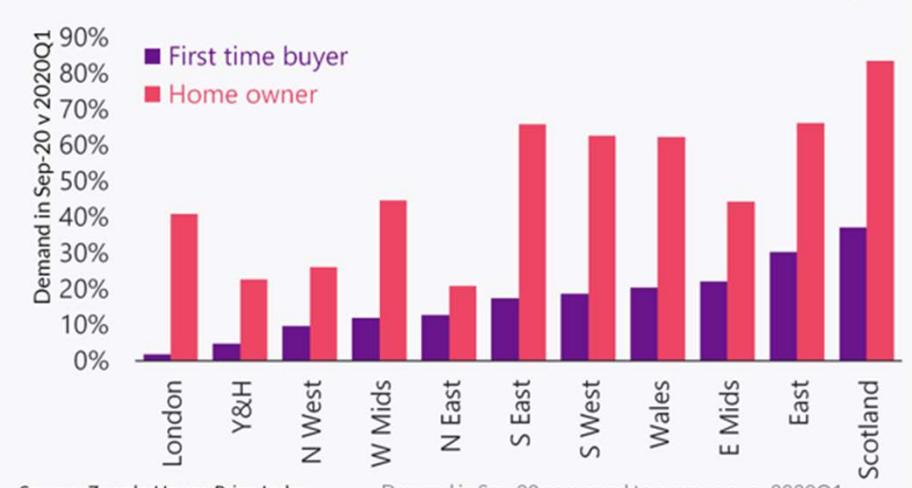
On a regional basis, the relative strength of FTB demand is not uniform. This reflects the underlying profile of buyers and the level of reliance on higher loan to value (LTV) mortgages, particularly at or above 90% LTV.
In 2019 around a fifth of all mortgages for home purchase were at this level. Reduced availability of mortgages at or over 90% LTV – as lenders meet increased demand at mid to lower LTVs – is a primary factor behind weakening demand.
90% LTV lending is most accessible in housing markets that have average or below average house prices where loan to income limits do not exclude a high proportion of would-be buyers.
The strongest growth in FTB numbers in recent years has been in regional markets outside southern England and we expect FTB demand to be more affected in these regions.
In higher priced markets, such as in London, 90% LTV finance is limited to those on high incomes and FTBs already put down larger deposits meaning this market is likely to be less affected by reduced availability of high LTV loans.
However, high deposits and a search for space in the wake of COVID means a greater proportion of FTBs in London may be looking to move out into adjacent commuter areas.
Shift in mix of sales from FTBs to existing homeowners
Over the last decade, FTBs have been a key driver of increased housing sales. They have accounted for a growing share of home purchases over time. FTB demand over this period has been buoyed by Help to Buy and greater competition in the higher LTV mortgage market.
In 2019, FTBs overtook mortgaged home-owners as the largest buyer group. This trend is set to reverse as we move into 2021 with increased movement from existing home-owners while FTB demand weakens in the face of restricted mortgage availability, tighter lending criteria and growing economic uncertainty.
Equity rich home-owners support housing market activity
Existing mortgaged home-owners have accounted for an increasingly smaller share of sales over the last decade as home-owners have stayed put and looked to extend and pay down mortgage debt.
COVID-19, the search for space and quality of location has unlocked latent demand to move in this large group and this is resulting in more sales in the existing home-owner segment.
Affordability is less of a barrier to movement. Existing owners tend to be older - 75% of all home-owners are over the age of 45 - and have more housing equity to help fund new purchases. Indeed, more than half of all home-owners have no mortgage at all, so can potentially make the move as cash buyers - a group that accounts for over a quarter of all sales.
The shift in sales towards existing home-owners will take time to feed through. This year we expect the mix of sales to broadly match that in 2019 albeit with mortgaged home-owners becoming the largest buyer group once again. This gap is likely to widen further into 2021.
How long can current market conditions be sustained?
We do not expect much change in current trends over the rest of 2020 although a further moderation in demand is likely as we move further into the autumn.
As well as the economic outlook and market sentiment, we need to keep a watchful eye on the relatively rapid increase in new supply and the pricing of this new stock.
If demand were to weaken suddenly then there is a risk of an overhang of unsold stock and slowing in sale that would most likely require price reductions to support sales.
This process can take up to 6 months to work through the system. This is one of many risks facing the market but, for now, the post lockdown boost to demand is supporting unseasonably strong housing market conditions.
The shift in the profile of demand towards home movers is one that has much further to run in our view.
UK House Price Index – August 2020
By Richard DonnellRelated articles
Sellers need to remain realistic on where they set the asking price if they are to take advantage of improving market conditions to secure a sale and move home in 2024.
After a busy start to 2022, the market will start to move back to pre-pandemic conditions, allowing supply pipelines to rebuild. However, the demand/supply imbalance will not fully unwind, and this will be one factor supporting price growth of 3% next year.
House price growth is starting to ease, although the path over the next year will not be linear. We expect UK average price growth to end 2022 firmly in positive territory at 3%.
The impact of the pandemic has further to run. The current momentum in the market will largely offset growing headwinds over 2022 with average UK house prices increasing by 3% and 1.2m sales.

Subscribe to receive email updates.
HometrackGlobal:
Linked In: